
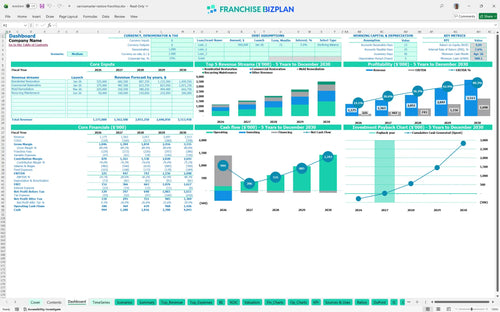
All-in-one Dashboard
Core inputs and core outputs


This financial model template for emergency restoration business provides a complete toolkit for analyzing startup costs, 5-year P&L forecasts, and unit-level cash flow dynamics.
Core inputs and core outputs
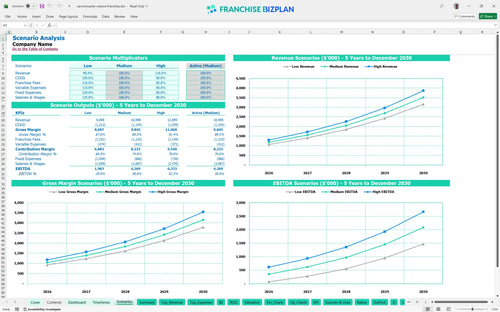
Three scenario analysis
Presentation ready
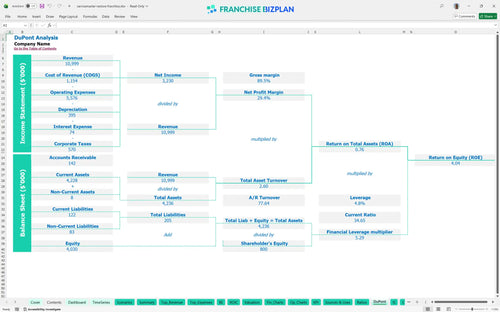
DuPont analysis
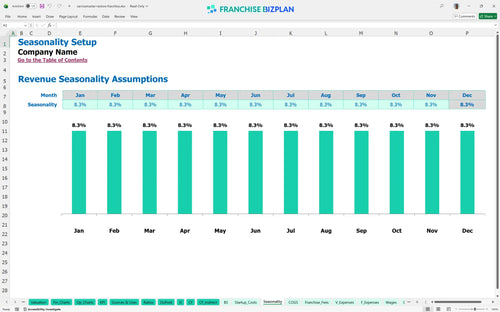
Researched revenue assumptions
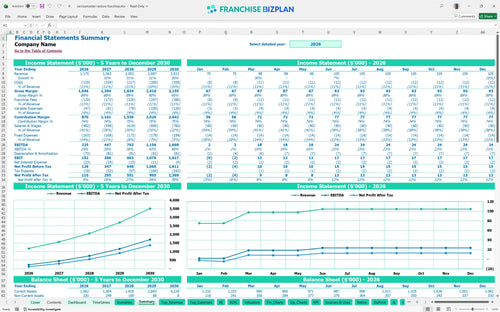
Lender-friendly financial outputs
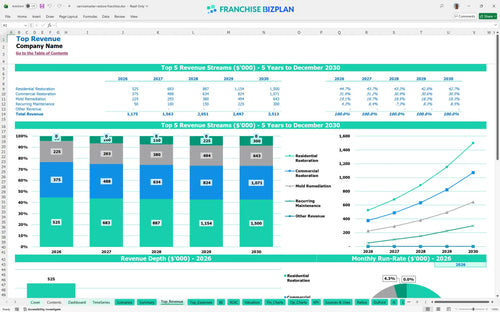
Revenue stream detailed view
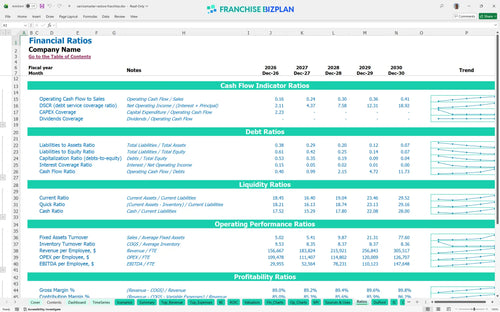
Performance metrics benchmark
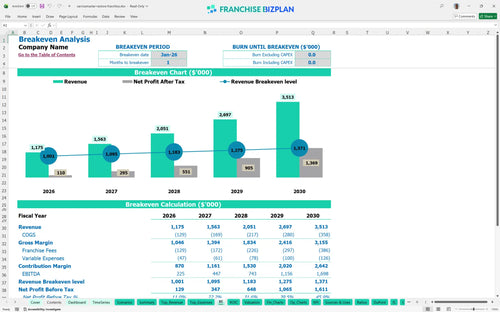
We built this restoration franchise business model financial plan using detailed research on unit-level performance and cost structures. Key assumptions, including the $72,500 franchise fee and 10% royalty rates, are pre-populated but fully editable to match your specific location. With Year 1 revenue starting at $1,175,000 and scaling to $3,513,000, this model provides a credible roadmap for your investment.
Profitability for this property damage franchise hits almost immediately, with a break-even date of January 2026. By Year 5, EBITDA is projected to reach $1,698,000 as you scale into commercial restoration and mold remediation services. Profitability hits fast here.
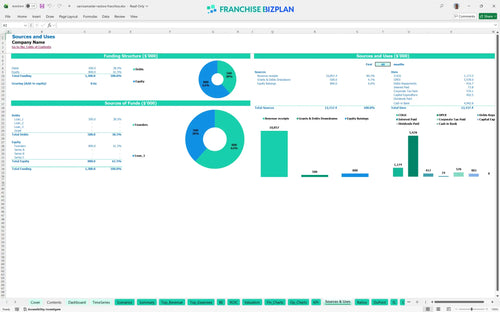
To launch this disaster restoration franchise investment, you need to cover $317,500 in primary CAPEX, including $120,000 for fleet vehicles and $80,000 for warehouse improvements. You also need to plan for a minimum cash requirement of $900,000 by April 2026 to handle the ramp-up phase. You need significant liquidity to start.
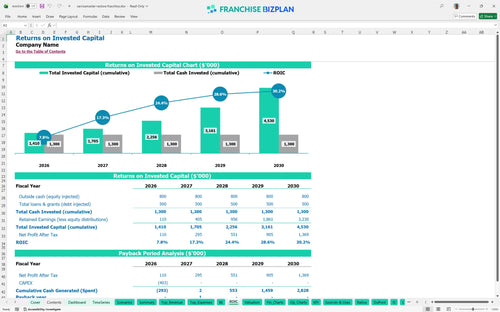
This franchise unit financial forecasting excel spreadsheet shows an Internal Rate of Return (IRR) of 7.56% and a 2-year payback period. While the return on equity is 4.04, the real value lies in the scaling EBITDA which grows from $225,000 in Year 1 to over $1.6M by Year 5. Payback happens in about 2 years.
The monthly break-even point is reached in January 2026, just one month after launch. Reaching this milestone depends heavily on your residential restoration volume, which is the primary revenue driver at $350,000 in the first year. The biggest driver is volume.
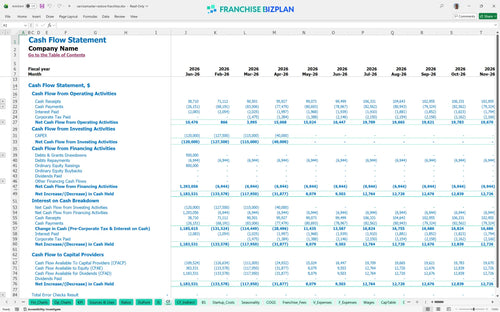
Your lowest cash point is $900,000 in April 2026, meaning you need a solid small business accounting template to track every cent during the first quarter. You defintely need to manage the timing of your $25,000 moisture detection tech and $20,000 in supplies to avoid a liquidity crunch. This is the danger zone.
Analyzing recurring revenue for restoration franchises shows that a high-growth scenario can push Year 5 revenue to $3.51M. If you face a low-demand period, your 11% total franchise fees will put pressure on your Year 1 EBITDA of $225,000. A 10% drop in revenue can delay your 2-year payback significantly.
This franchise financial model template is fully customizable in Excel, featuring pre-filled formulas and editable assumptions that allow you to adapt the numbers to your specific territory and local market conditions. You can easily modify revenue drivers, labor costs, and capital expenditures to create a realistic business plan financial forecast.

Our franchise financial projection spreadsheet provides a detailed five-year outlook, mapping out revenue growth from $1.17M in Year 1 to over $3.5M by Year 5. It includes integrated cash flow statements and profit and loss templates to ensure you have a clear view of long-term profitability and scaling potential.

Managing franchise unit economics requires precise tracking of gross-line deductions like the 10% royalty and 1% marketing fund contributions. This model captures these ongoing obligations alongside the initial $72,500 franchise fee, so you can see exactly how brand costs impact your store-level margin.

This tool simplifies how to calculate startup costs for a restoration franchise by breaking down fleet investments, warehouse improvements, and equipment needs. It includes a built-in break-even analysis to identify the exact sales volume required to cover your $7,500 monthly rent and other fixed overhead.

We include a franchise ROI analysis by incorporating industry-standard benchmarks for restoration materials (8%) and labor productivity. These metrics help you sanity-check your assumptions against typical property damage franchise performance to ensure your financial plan is grounded in reality.


Simply purchase and download the financial model template, then access it instantly using Microsoft Excel or Google Sheets. No installation or technical expertise required-just open and start working.

Enter your business-specific numbers, including revenue projections, costs, and investment details. The pre-built formulas will automatically calculate financial insights, saving you time and effort.

Leverage the investor-ready format to confidently showcase your financial projections to banks, franchise representatives, or investors. Impress stakeholders with clear, data-driven insights and professional reports.

Leverage the investor-ready format to confidently present your projections to banks, franchise representatives, or investors.