
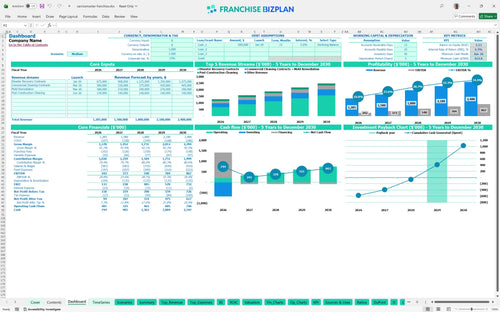
All-in-one Dashboard
Core inputs and core outputs


This restoration franchise financial model excel template provides all the tools needed to forecast revenue, manage expenses, and analyze the long-term ROI of your investment.
Core inputs and core outputs
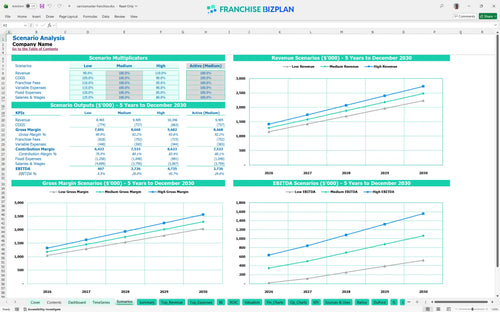
Three scenario analysis
Presentation ready
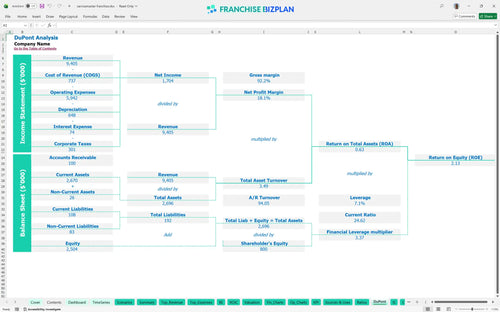
DuPont analysis
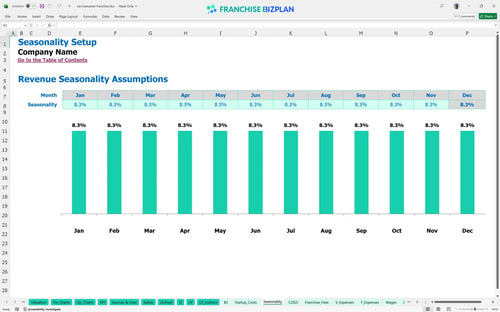
Researched revenue assumptions
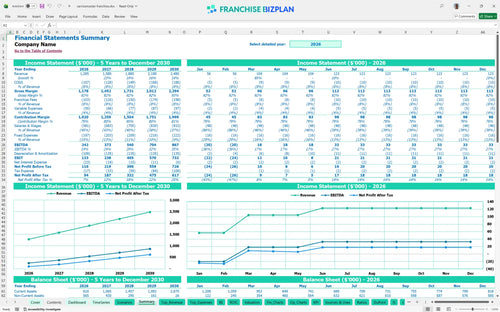
Lender-friendly financial outputs
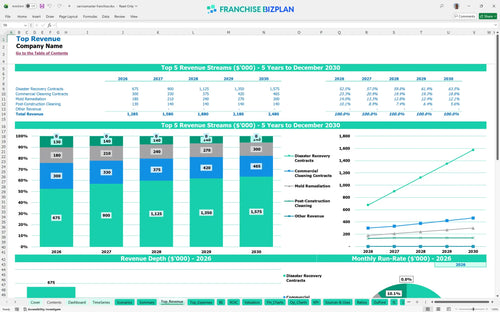
Revenue stream detailed view
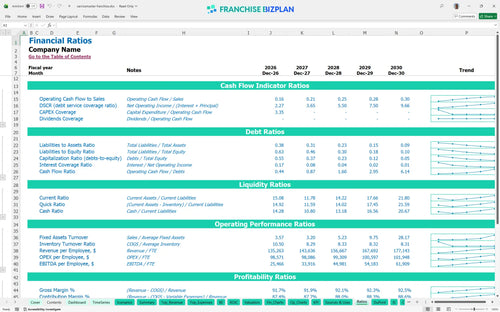
Performance metrics benchmark
We built this restoration franchise unit financial model using our own research to reflect the actual cleaning franchise startup costs and operating realities. Key assumptions, including the $1.285 million year-one revenue target and the $242,000 EBITDA projection, are pre-populated and fully editable. This tool helps you map out everything from the $72,500 initial fee to the 24/7 staffing requirements needed for emergency response.
The unit reaches an EBITDA-positive state in its first year of operation, generating $242,000 in earnings. Profitability scales as you start estimating recurring revenue for restoration franchises, with EBITDA reaching $867,000 by year five as disaster recovery contracts grow to $1.05 million annually.
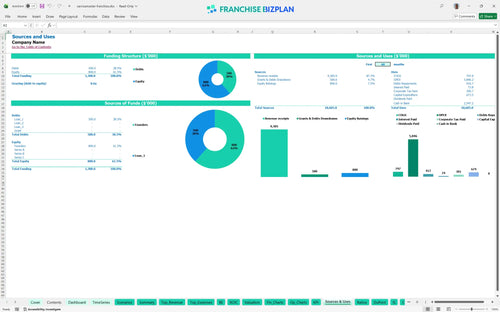
You need a startup budget for property restoration franchise operations of approximately $673,500 to cover the franchise fee, equipment, and initial working capital. This budget includes $200,000 for leasehold improvements and $150,000 for a specialized service vehicle fleet to handle regional demand.
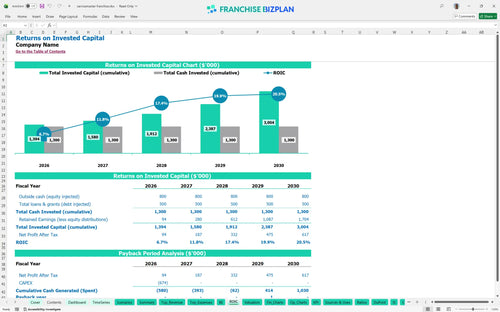
Using our franchise investment ROI calculator for restoration, the model projects an Internal Rate of Return (IRR) of 4.35% and a Return on Equity (ROE) of 2.13. With a four-year payback period, the investment stabilizes as recurring cleaning contracts provide a steady base for high-value restoration work.
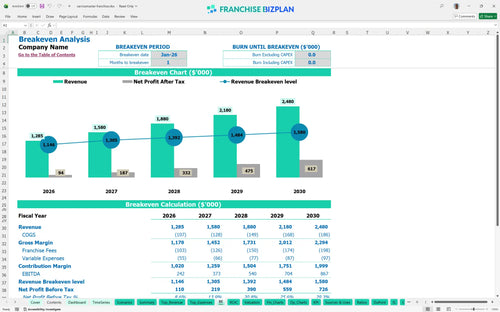
The unit hits its break-even date in January 2026, just one month after launch, provided you are successful in calculating insurance referral revenue in franchise models correctly. Reaching this point depends on securing the initial $450,000 in disaster recovery contracts and managing the $8,500 monthly rent for the operations center.
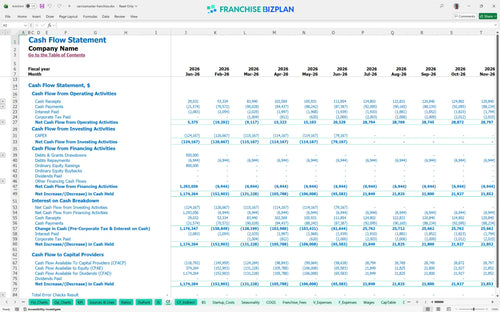
The lowest cash point is projected at $613,000 in June 2026, which serves as a budget template for disaster recovery service business planning. You should maintain a cash buffer to handle the timing gap between completing restoration jobs and receiving insurance payouts, which can stretch working capital.
Financial forecasting tools for new franchise owners show that a high-revenue scenario can push Year 5 EBITDA well above the $867,000 baseline. Conversely, if labor costs rise or contract volume dips, the four-year payback period could extend, making manager productivity and local marketing execution vital.
This restoration franchise financial model is a fully customizable Excel tool that lets you swap out every assumption to fit your specific territory. You can adjust revenue drivers like disaster recovery contracts or mold remediation volume while the pre-filled formulas handle the heavy lifting. It defintely simplifies the process of modeling staffing, payroll, and operating expenses for a new unit.

Long-term planning requires a clear view of how your restoration business scales from year one to year five. This model provides detailed 5-year franchise financial projections excel views, allowing you to see the impact of adding technicians or vehicles over time. You get a full balance sheet view to track assets like your $150,000 service vehicle fleet.

Managing franchise-specific obligations is critical for maintaining store-level margins. The model acts as a franchise royalty fee calculator, determining the 7% royalty and 1% marketing fund contributions automatically based on gross sales. It captures the initial $72,500 franchise fee and ongoing brand fund contributions to ensure your unit economics are realistic.

Learning how to calculate startup costs for a restoration franchise is the first step toward a successful launch. This tool breaks down your $673,500 in initial capital needs, from leasehold improvements to equipment, and calculates the sales volume needed to cover fixed costs. You can see exactly how many disaster recovery jobs it takes to reach your contribution margin targets.

Using built-in restoration industry benchmarks helps you sanity-check your restoration business profitability analysis. The model includes typical ranges for labor costs, which are vital when managing a team of technicians and cleaning crews. You can compare your expected gross margins against industry standards to ensure your pricing for mold remediation and commercial cleaning is competitive.


Simply purchase and download the financial model template, then access it instantly using Microsoft Excel or Google Sheets. No installation or technical expertise required-just open and start working.

Enter your business-specific numbers, including revenue projections, costs, and investment details. The pre-built formulas will automatically calculate financial insights, saving you time and effort.

Leverage the investor-ready format to confidently showcase your financial projections to banks, franchise representatives, or investors. Impress stakeholders with clear, data-driven insights and professional reports.

Leverage the investor-ready format to confidently present your projections to banks, franchise representatives, or investors.