
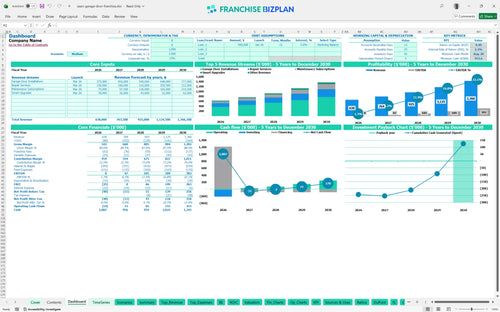
All-in-one Dashboard
Core inputs and core outputs


This franchise unit financial model template provides a complete Excel-based framework for forecasting revenue, expenses, and cash flow for a mobile service business.
Core inputs and core outputs
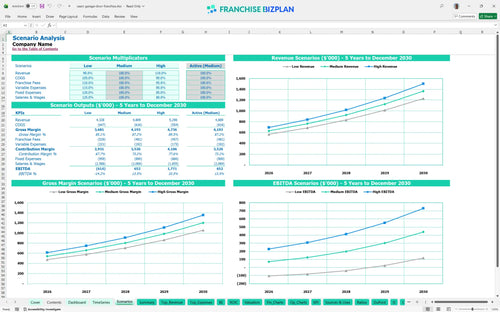
Three scenario analysis
Presentation ready
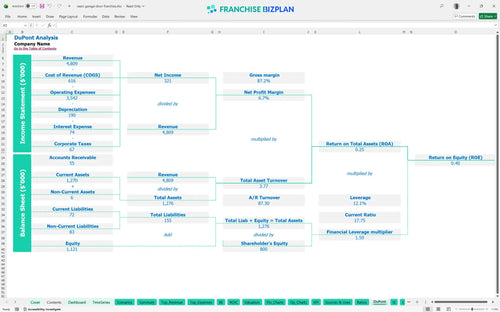
DuPont analysis
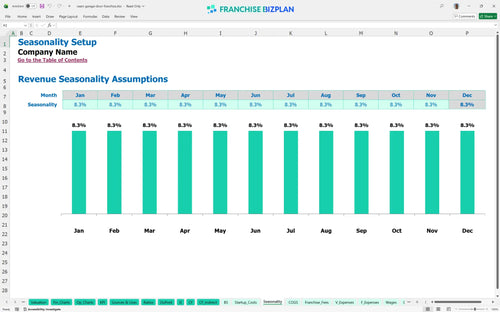
Researched revenue assumptions
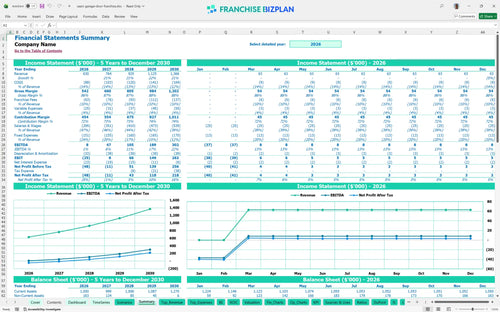
Lender-friendly financial outputs
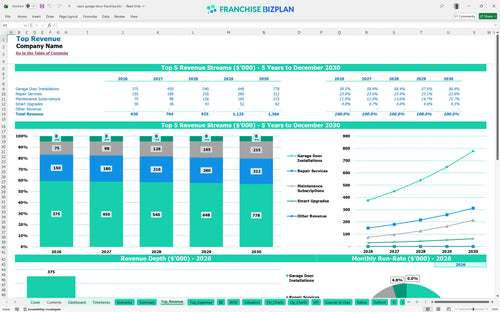
Revenue stream detailed view
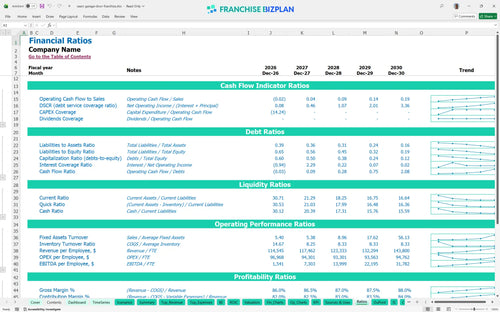
Performance metrics benchmark
We built this franchise unit financial model using our own research to ensure your planning is grounded in reality. Key assumptions, including the $40,000 franchise fee and technician scaling, are pre-populated with researched data and are fully editable to match your specific territory. With a projected year-one EBITDA of $8,000 growing to $302,000 by year five, this tool shows the path from startup to a mature, high-margin operation.
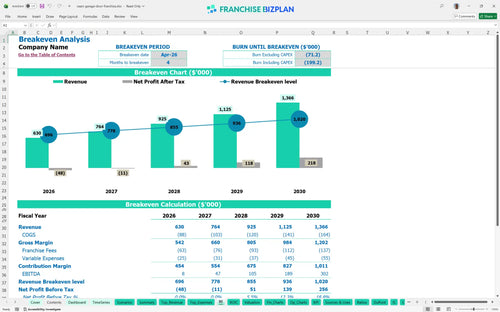
Profitability arrives quickly in this model, with a break-even date projected for April 2026, just four months after launch. While year one shows a slim $8,000 EBITDA, the business scales significantly as maintenance subscriptions and smart upgrades build a recurring revenue base. By year three, you are looking at $105,000 in earnings after all royalties and fixed costs.
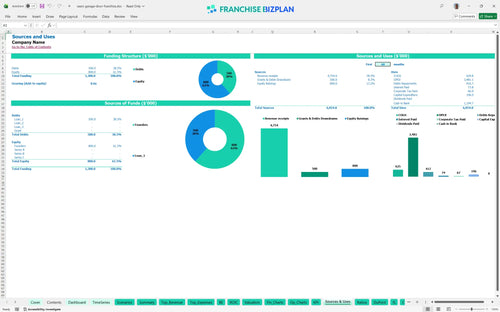
You will need approximately $196,000 in total capital to cover the initial franchise fee, fleet vehicles, and warehouse setup. This financial breakdown of mobile service business model includes $75,000 for service vehicles and $30,000 for leasehold improvements. A cash buffer is essential, as the model shows the lowest cash point occurring well into the operation ramp-up.
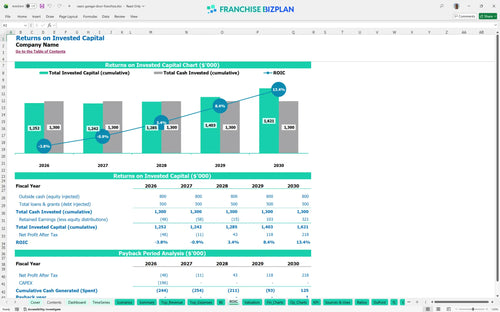
The model projects a 5-year payback period with an internal rate of return (IRR) of 2.18% and a return on equity (ROE) of 0.4. While the initial IRR seems conservative, it reflects a realistic ramp-up of a multi-technician fleet and the heavy front-loaded investment in vehicles. Long-term value is driven by the 22% net margin potential seen by the fifth year of operation.
You hit the monthly break-even point in month four, provided you reach the necessary volume of installations and repairs. The primary driver for break-even is technician throughput; since labor is your largest variable cost, keeping your 2.5 initial technicians busy is critical. Fixed costs like the $6,000 warehouse rent stay constant, making volume the key lever for reaching profitability.
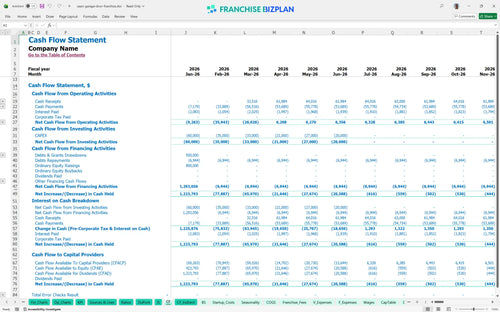
The lowest cash point occurs in August 2028, suggesting that while the unit is profitable early, growth-related CAPEX like adding more vehicles can strain liquidity. You need to maintain a solid working capital buffer to handle the timing gap between paying technicians and receiving payments for large installations. Managing your $12,000 initial parts inventory carefully will help protect your cash position during the ramp-up.
Analyzing profit margins for garage door installation across low, medium, and high scenarios shows how sensitive the model is to ticket size. A 10% drop in revenue in a low case can delay your payback period by over a year due to the fixed royalty and rent burden. Conversely, the high case leverages the existing office staff to support more technicians, significantly boosting the year-one $8,000 EBITDA.
This garage door franchise opportunity requires a flexible tool to model local market variables like technician labor rates and regional fuel costs. Our fully customizable franchise financial model template features editable assumptions in Excel that let you swap out pre-filled data for your specific territory's rent and permit costs. It defintely simplifies complex math so you can focus on local demand and site-level execution.

Moving from a single van to a multi-unit fleet requires a home service franchise business plan that looks past the first year. This model tracks revenue scaling from $630,000 in year one to over $1.3 million by year five, accounting for technician headcount growth and fleet expansion. You get a full view of how margins shift as you move from urgent repairs to high-end smart upgrades over a 60-month horizon.

Understanding how to calculate royalty payments in franchise modeling is vital for protecting your store-level margin. With an 8% royalty and a 2% marketing fee, $10 out of every $100 earned goes to the franchisor before you pay for fuel or parts. This model captures these specific financial obligations against your projected installation and repair volume to ensure your net cash flow stays positive after brand fund contributions.

Your initial investment involves more than just the $40,000 franchise fee; you need to account for fleet vehicles and warehouse improvements. This franchise startup cost calculator helps you identify the exact sales volume needed to cover your $12,350 in monthly fixed costs, including rent and insurance. Knowing your break-even point helps you manage the early months when technician productivity and local brand awareness are still ramping up.

We use a garage door installation business model built on real-world data to help you evaluate franchise unit economic performance. By comparing your labor costs-which scale as you add technicians from 2.5 to 6.5 FTEs-against industry standards, you can spot margin leaks early. These built-in benchmarks act as a sanity check for your white-glove service pricing and maintenance subscription targets.


Simply purchase and download the financial model template, then access it instantly using Microsoft Excel or Google Sheets. No installation or technical expertise required-just open and start working.

Enter your business-specific numbers, including revenue projections, costs, and investment details. The pre-built formulas will automatically calculate financial insights, saving you time and effort.

Leverage the investor-ready format to confidently showcase your financial projections to banks, franchise representatives, or investors. Impress stakeholders with clear, data-driven insights and professional reports.

Leverage the investor-ready format to confidently present your projections to banks, franchise representatives, or investors.