
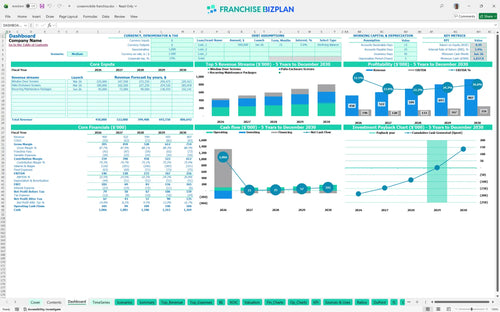
All-in-one Dashboard
Core inputs and core outputs


This Excel template for franchise financial projections includes detailed revenue drivers, a full staffing plan, and a capital expenditure schedule tailored for mobile fabrication.
Core inputs and core outputs
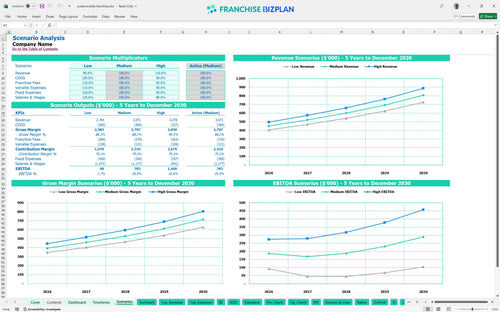
Three scenario analysis
Presentation ready
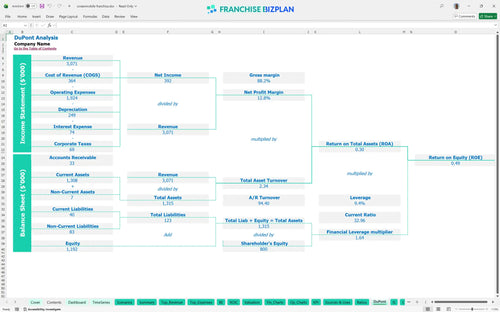
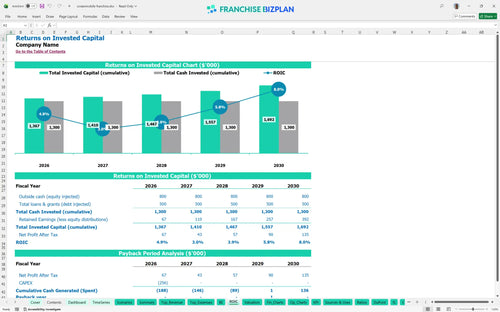
DuPont analysis
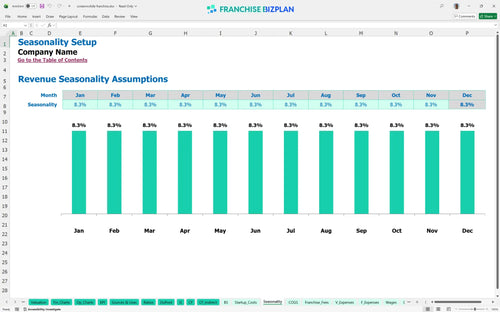
Researched revenue assumptions
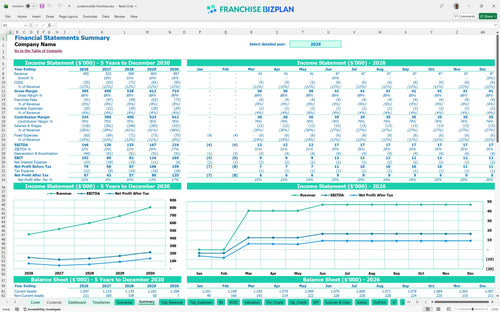
Lender-friendly financial outputs
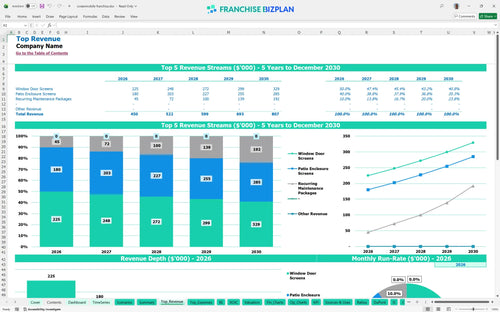
Revenue stream detailed view
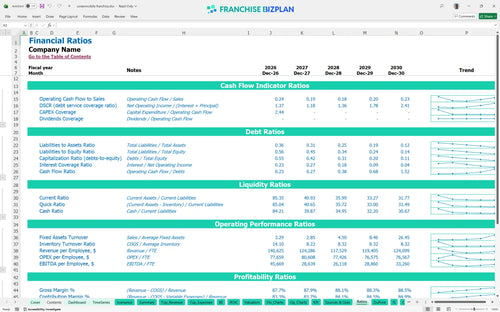
Performance metrics benchmark
We built this franchise unit business plan using deep research into mobile screen repair operations. Key assumptions like the $120,000 mobile workshop cost and 7% royalty fees are pre-populated and fully editable. Based on the data, this unit hits its stride quickly, reaching a positive EBITDA of $146,000 in the first year.
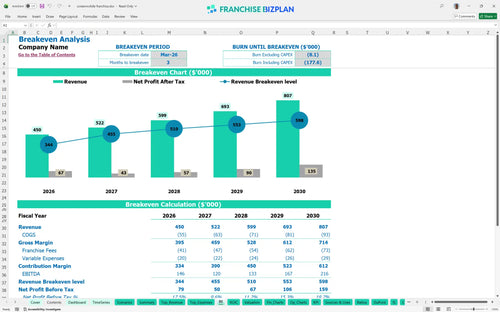
You can expect this mobile service unit to become profitable almost immediately, with a breakeven date of March 2026. By year five, the net profit expands as revenue climbs toward $807,000 and material costs stabilize.
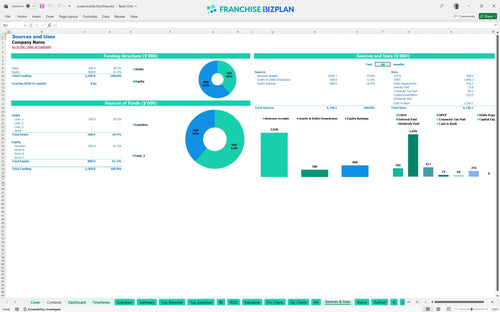
Launching this mobile fabrication business requires a total initial investment of roughly $255,500 when accounting for the workshop and equipment. You will need to cover the $49,500 franchise fee and have enough working capital to handle the ramp-up phase.
The franchise investment ROI spreadsheet shows a payback period of 4 years, which is standard for high-capex mobile units. With an IRR of 3.42% and a Return on Equity of 0.49, the long-term value is built on steady residential demand rather than overnight windfalls.
Calculating break-even point for new franchise location shows you need to hit your target volume by month 3. The primary driver here is the volume of window and door screen jobs, as fixed costs like the $2,400 workshop lease stay constant regardless of your daily ticket count.
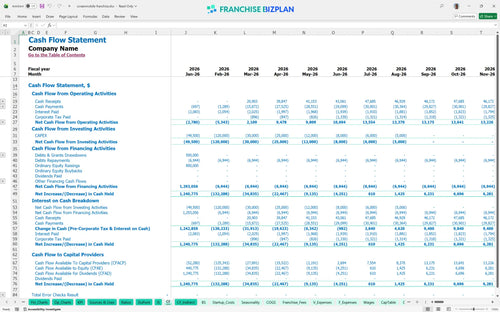
The lowest cash point occurs in June 2026, where the balance dips to $1,038. This is a tight margin, so having a small cash buffer is defintely recommended to handle any delays in the $30,000 recurring maintenance revenue stream.
Our profitability analysis for home service franchise units compares different market conditions. A High scenario-driven by better local marketing execution-can push year-1 margins well above the $146,000 EBITDA mark, while a Low scenario might extend the 4-year payback period if sales coordinator productivity lags.
This franchise unit financial model template is built in Excel, giving you total control over the numbers. You can tweak the pre-filled formulas and editable assumptions to match your specific territory or local labor market. It's designed so you can test different pricing for window screens or patio enclosures without breaking the logic.

Planning a mobile service franchise financial forecast requires looking beyond the first season. This model provides a full 5-year view of your revenue, expenses, and cash flow to help you see the big picture. We've mapped out the growth from $450,000 in year one to over $800,000 by year five so you can plan for equipment upgrades and additional staff.

Understanding the real cost of the brand is vital for any home service franchise profitability analysis. The model handles the 7% royalty and 2% marketing fund contributions automatically based on your sales volume. It also accounts for the initial $49,500 franchise fee in your startup capital stack so there are no surprises on day one.

Figuring out how to calculate startup costs for a mobile franchise is the first step to a solid launch. This tool aggregates your mobile workshop, fabrication equipment, and initial inventory to show your total entry cost. It then calculates the exact sales volume needed to cover your $2,400 monthly lease and other fixed overheads.

We've baked in industry standards to help you verify your unit economics. If your fuel and vehicle maintenance costs deviate significantly from the 3.2% benchmark, the model helps you spot the leak. It's a built-in sanity check to ensure your residential home maintenance franchise projections stay grounded in operational reality.


Simply purchase and download the financial model template, then access it instantly using Microsoft Excel or Google Sheets. No installation or technical expertise required-just open and start working.

Enter your business-specific numbers, including revenue projections, costs, and investment details. The pre-built formulas will automatically calculate financial insights, saving you time and effort.

Leverage the investor-ready format to confidently showcase your financial projections to banks, franchise representatives, or investors. Impress stakeholders with clear, data-driven insights and professional reports.

Leverage the investor-ready format to confidently present your projections to banks, franchise representatives, or investors.