
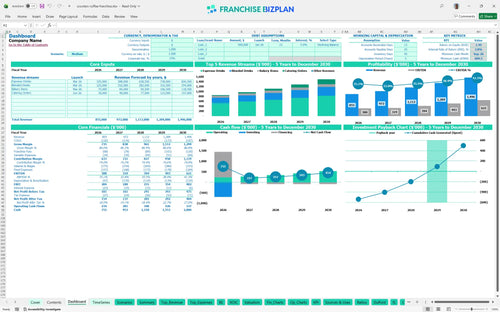
All-in-one Dashboard
Core inputs and core outputs


This coffee shop business plan template includes a dynamic Excel engine that links your startup CAPEX, tiered labor schedules, and multi-channel revenue streams into a single, cohesive dashboard.
Core inputs and core outputs
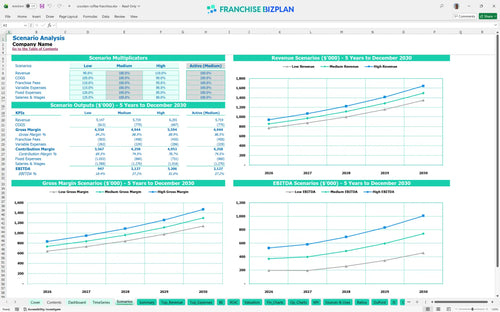
Three scenario analysis
Presentation ready
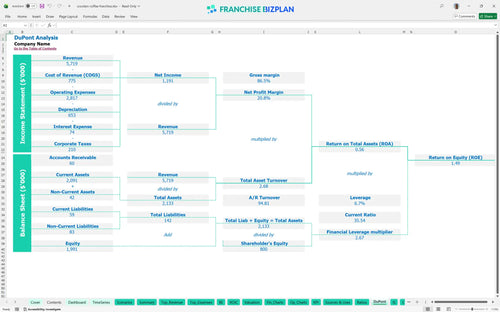
DuPont analysis
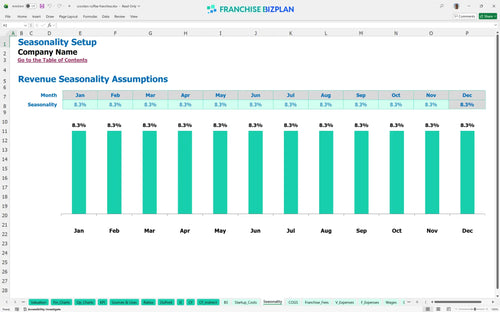
Researched revenue assumptions
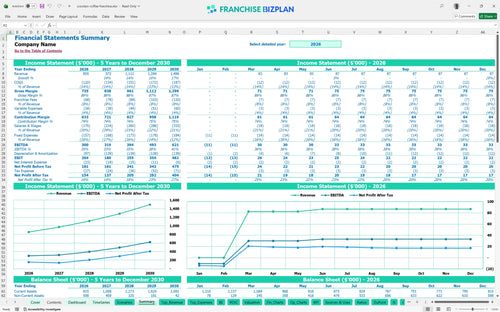
Lender-friendly financial outputs
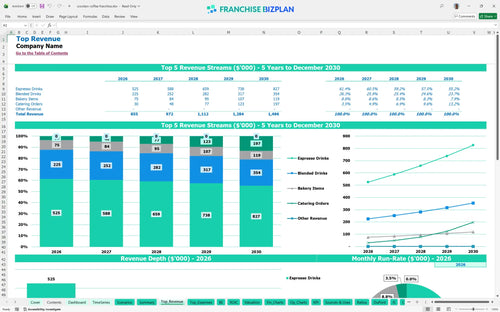
Revenue stream detailed view
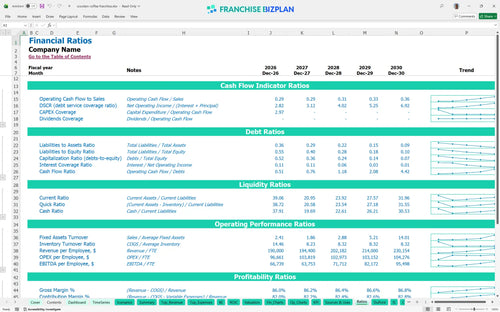
Performance metrics benchmark
We built this franchise unit financial model based on deep-dive research into drive-thru coffee economics and regional performance data. Every assumption-from the $40,000 initial fee to the 3-month ramp-up to break-even-is pre-populated but fully adjustable to fit your specific territory. With a projected Year 1 EBITDA of $300,000, the model provides a realistic baseline for your investment feasibility study.
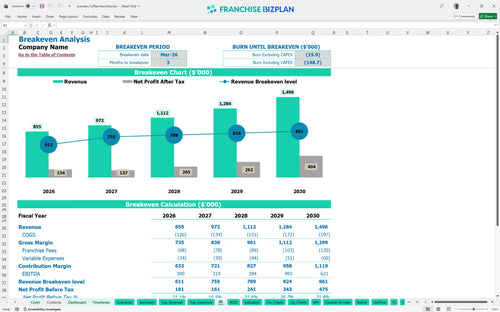
You can expect to hit monthly break-even by March 2026, just three months after launching your drive-thru coffee business financial model. While Year 1 EBITDA starts at $300,000, the real momentum builds by Year 5 as revenue climbs toward $1,496,000 and beverage COGS efficiency improves.
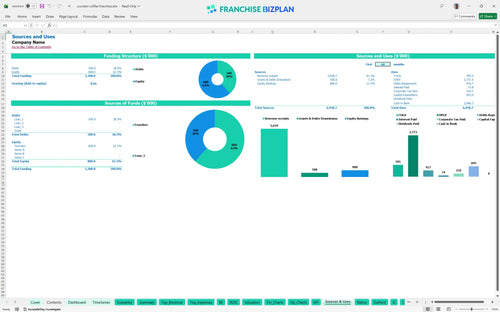
You'll need a total initial investment covering roughly $695,000 in major line items plus a cash buffer to reach your $689,000 minimum cash point in late 2026. This restaurant franchise startup cost breakdown covers the $40,000 franchise fee, $350,000 kiosk build-out, and $80,000 in espresso equipment.
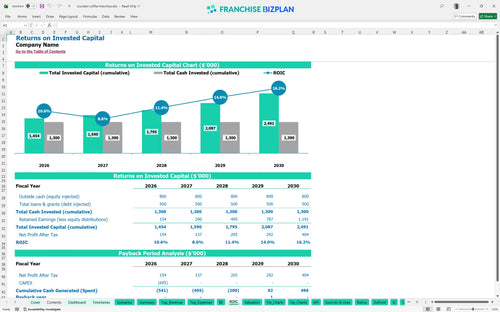
This model projects a 4-year payback period with an Internal Rate of Return (IRR) of 3.76%. While the Return on Equity (ROE) sits at 1.49, the long-term value lies in the steady climb of net margins as your local brand equity grows and revenue scales.
You hit break-even in month 3, provided you hit your $855,000 Year 1 revenue target through high-volume daily sales. The biggest hurdle is the $9,000 monthly rent, so maximizing throughput during the morning commute window is critical to covering those fixed costs.
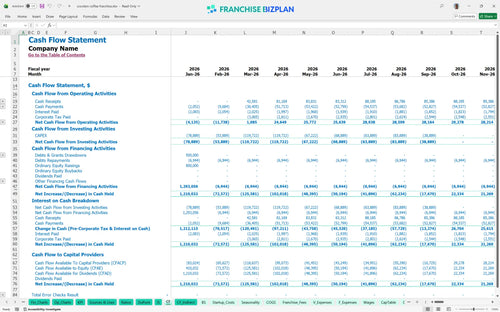
Your lowest cash point hits in September 2026 at approximately $689,000, largely due to the timing of construction payments and the initial ramp-up. You need enough working capital to bridge the gap between your January construction start and the March opening.
A high-performance scenario where catering hits $197,000 by Year 5 significantly improves your coffee shop franchise startup costs excel template outcomes. Conversely, if labor costs for your baristas and supervisors spike, your peak cash need will deepen, potentially pushing your break-even date further out.
This franchise unit financial model lives in Excel, giving you total control over every variable from espresso shot pricing to barista headcounts. We've pre-loaded it with researched data, but you can defintely swap in your specific local rent or utility quotes to see how they shift your bottom line.

Mapping out five years helps you see past the initial construction phase and into the mature-unit phase where catering and loyalty app users drive the bulk of your gains. With revenue projected to grow from $855,000 in year one to nearly $1.5M by year five, this tool helps you visualize how scaling throughput impacts your total cash position.

Operating a major brand means staying on top of the 6% royalty and 2% marketing fund that come off the top of your gross sales. This model automates those calculations so you know exactly how much goes to corporate before you pay for your milk, beans, or labor.

Launching a kiosk requires significant upfront capital, including $350,000 for construction and $80,000 for high-end espresso gear. Our break-even analysis shows you the exact month-projected for March 2026-when your daily latte and bakery sales finally cover your $9,000 monthly rent and other fixed costs.

Don't guess if your 10.5% beverage COGS (cost of goods sold) is healthy; use our built-in benchmarks to see how you stack up against other high-volume coffee kiosks. We've included typical ranges for labor and occupancy so you can spot margin leaks before they drain your bank account.


Simply purchase and download the financial model template, then access it instantly using Microsoft Excel or Google Sheets. No installation or technical expertise required-just open and start working.

Enter your business-specific numbers, including revenue projections, costs, and investment details. The pre-built formulas will automatically calculate financial insights, saving you time and effort.

Leverage the investor-ready format to confidently showcase your financial projections to banks, franchise representatives, or investors. Impress stakeholders with clear, data-driven insights and professional reports.

Leverage the investor-ready format to confidently present your projections to banks, franchise representatives, or investors.