
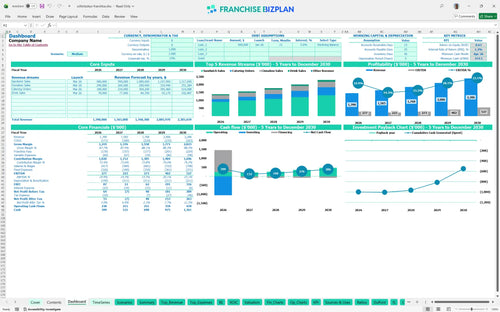
All-in-one Dashboard
Core inputs and core outputs


This comprehensive Excel template for restaurant franchise financial forecasting includes detailed revenue streams, a full capital expenditure budget, and 5-year profit and loss statements designed for professional-grade business planning.
Core inputs and core outputs
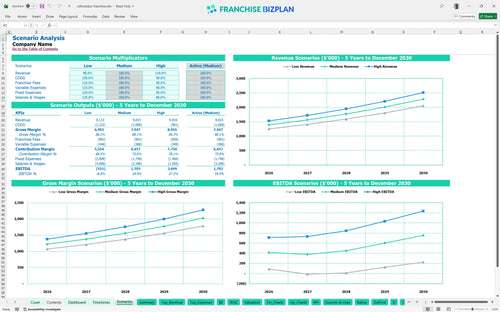
Three scenario analysis
Presentation ready
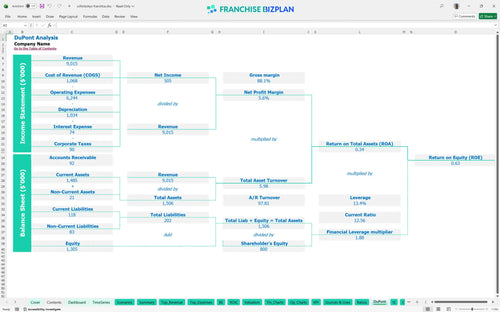
DuPont analysis
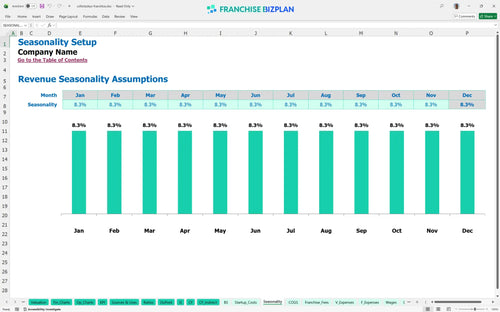
Researched revenue assumptions
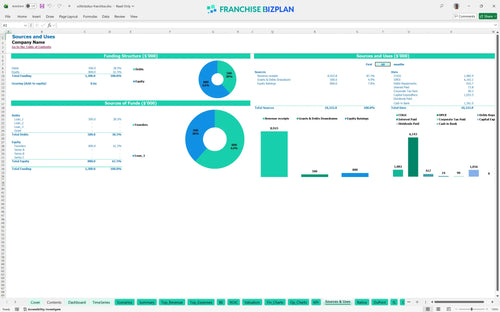
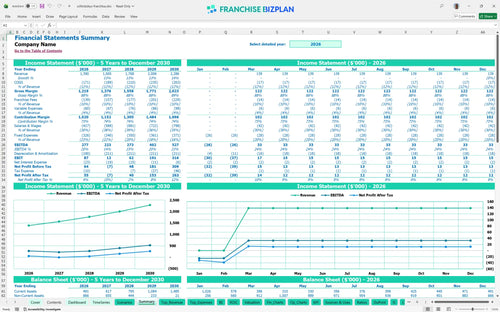
Lender-friendly financial outputs
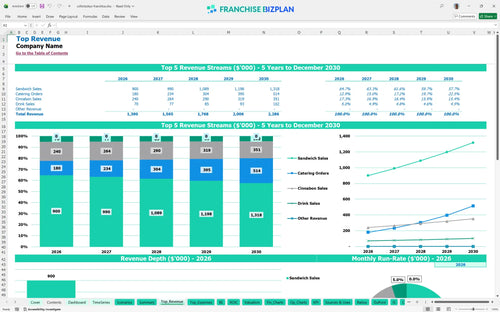
Revenue stream detailed view
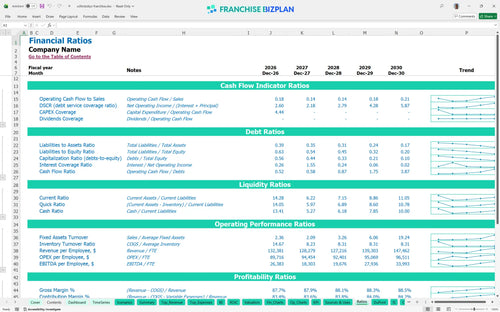
Performance metrics benchmark
We built this franchise unit financial model using our own research to provide a realistic look at the unit economics of this fast-casual concept. Key assumptions, including the $1.39M year-one revenue and the 6% royalty structure, are pre-populated and fully editable to match your specific site. This tool provides a data-driven foundation for your fast casual restaurant business plan.
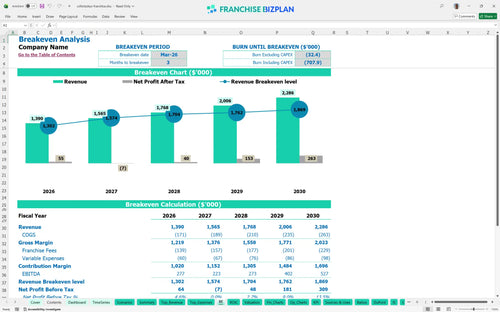
The model indicates that you will defintely reach the break-even date by March 2026, just three months after opening. This quick transition to profitability is driven by strong year-one EBITDA of $277,000, even after accounting for food costs and royalties. Speed to break-even is your first major milestone.
To launch this unit, you need a total initial investment of approximately $1,055,500, which covers the franchise fee, equipment, and significant leasehold improvements. This franchise investment calculator ensures you have enough liquidity to handle the $20,000 monthly rent during the ramp-up phase. Cash is king, but allocation is the kingdom.
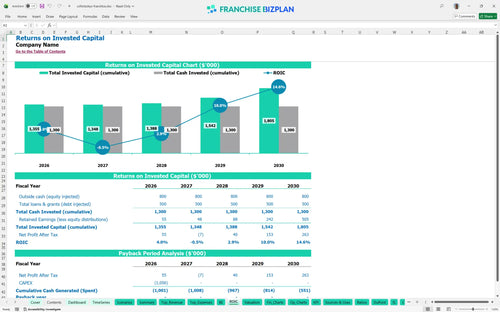
Analyzing franchise ROI for potential investors shows an Internal Rate of Return (IRR) of 1.19% and a Return on Equity (ROE) of 0.63. While the payback period extends beyond the five-year mark, the steady climb in EBITDA to $527,000 by year five suggests strong long-term value. Patience is a requirement for this capital-heavy model.
The monthly break-even analysis shows the unit needs to reach its stride by month three to cover the $28,500 in base monthly fixed costs. The primary driver for hitting this goal is sandwich sales volume, which is projected at $600,000 in the first year. Volume is the primary lever for hitting your numbers.
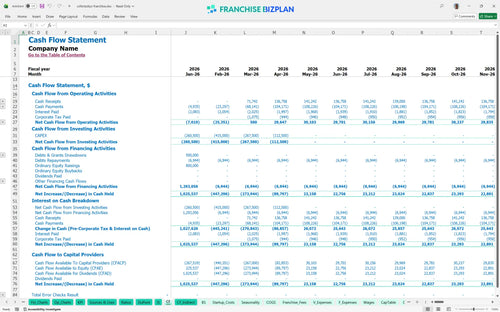
The lowest cash point occurs in April 2026 with a minimum cash balance of $214,000, providing a solid safety net after the initial build-out. Estimating franchise unit operating expenses accurately is vital to ensure this buffer remains intact during the first year. A healthy buffer is your best insurance policy.
Financial modeling for multi-unit franchise expansion reveals that a 10% drop in revenue significantly delays the payback period, while a high-performance scenario boosts year-five EBITDA well above $527,000. Scenarios help you understand how sensitive your margins are to labor and food cost fluctuations. Preparation for the high case is just as important as the low.
This franchise financial model template is built in Excel with pre-filled formulas and editable assumptions, allowing you to adapt the tool to your specific territory and local market conditions. You can adjust revenue drivers, labor rates, and rent to see how different operating scenarios impact your bottom line. Flexibility is the key to accurate forecasting.

Creating a 5-year financial projection for a franchise helps you visualize the path from grand opening to a mature, stabilized unit. This model tracks revenue growth from $1.39M in year one to over $2.28M by year five, providing a clear view of long-term cash flow and profit trends. Long-term views prevent short-term panic.

Tracking franchise royalty fees and brand fund contributions is essential for understanding your true store-level margin. The model automatically calculates the 6% royalty and 4% marketing fee against your projected sales, ensuring you account for every dollar owed to the franchisor. Fees are the price of brand power.

How to calculate startup costs for a restaurant franchise becomes simple with our detailed capital expenditure budget, covering everything from the $35,500 franchise fee to leasehold improvements. The break-even analysis identifies the exact sales volume needed to cover your $20,000 monthly rent and other fixed obligations. Knowing your floor is as vital as knowing your ceiling.

This restaurant profitability analysis incorporates unit economics and industry standards to help you sanity-check your projections against typical fast-casual performance. By comparing your labor and occupancy costs to established benchmarks, you can identify margin leaks before they become critical issues. Benchmarks keep your assumptions grounded in reality.


Simply purchase and download the financial model template, then access it instantly using Microsoft Excel or Google Sheets. No installation or technical expertise required-just open and start working.

Enter your business-specific numbers, including revenue projections, costs, and investment details. The pre-built formulas will automatically calculate financial insights, saving you time and effort.

Leverage the investor-ready format to confidently showcase your financial projections to banks, franchise representatives, or investors. Impress stakeholders with clear, data-driven insights and professional reports.

Leverage the investor-ready format to confidently present your projections to banks, franchise representatives, or investors.