
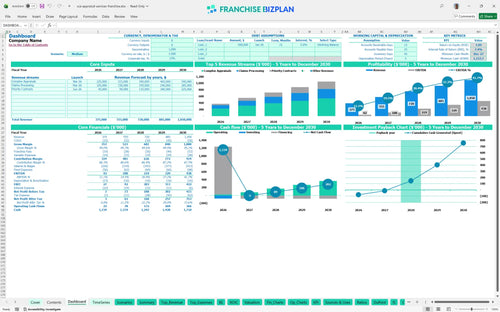
All-in-one Dashboard
Core inputs and core outputs


This franchise unit financial model template provides a complete Excel-based toolkit for forecasting revenue, managing specialized labor costs, and calculating long-term ROI for a mobile appraisal business.
Core inputs and core outputs
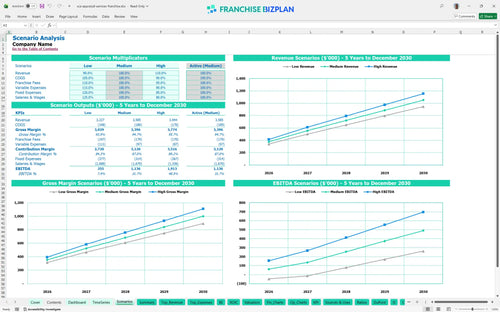
Three scenario analysis
Presentation ready
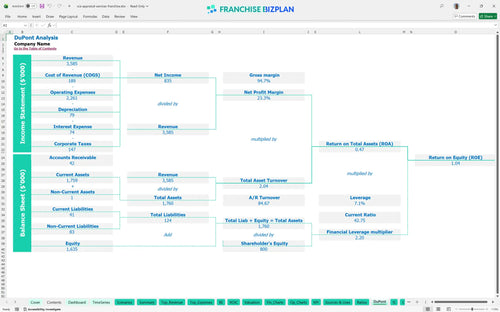
DuPont analysis
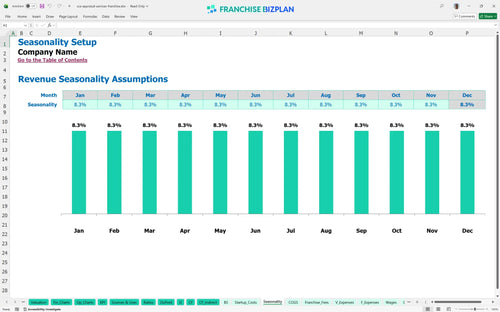
Researched revenue assumptions
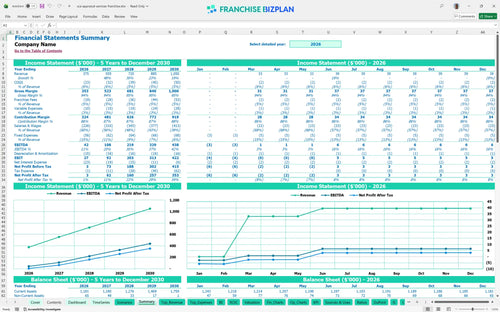
Lender-friendly financial outputs
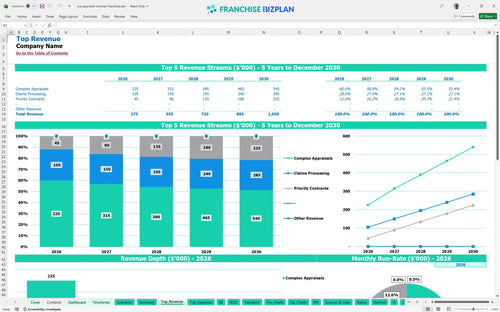
Revenue stream detailed view
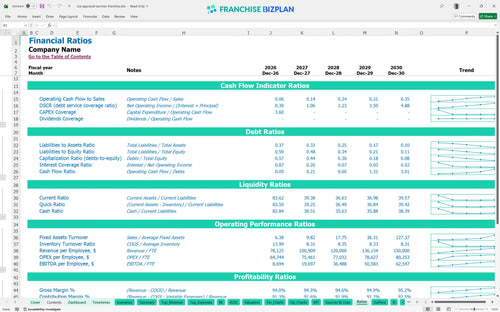
Performance metrics benchmark
We developed this franchise unit financial model using deep-dive research into the specialized appraisal sector. The pre-populated data reflects a Year 1 revenue of $375,000 and scales to $1,050,000, with all assumptions like the 5% royalty and $80,000 startup cost fully editable to match your specific territory. It's a pragmatic tool for evaluating franchise investment opportunities with financial models that actually reflect the daily grind of mobile operations.
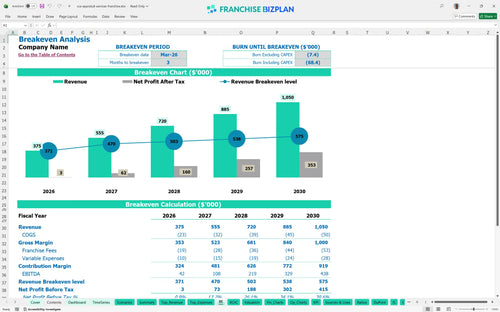
You can expect to hit the break-even point by March 2026, just 3 months after launching. Profitability scales significantly as revenue grows, with EBITDA jumping from $42,000 in Year 1 to $219,000 by Year 3 as you leverage fixed costs like rent and insurance. Here's the quick math: your margin expands from 11% to 41% as you maximize technician throughput.
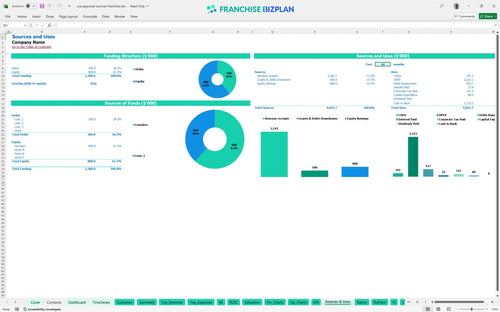
Launching this unit requires $80,000 in upfront capital for tangible assets plus a minimum cash reserve of $1,154,000 to handle long-term liquidity and ramp-up. Your startup budget template for specialized service franchises covers everything from the $40,000 franchise fee to the $15,000 mobile vehicle fleet. What this estimate hides is the timing of your first large claims check.
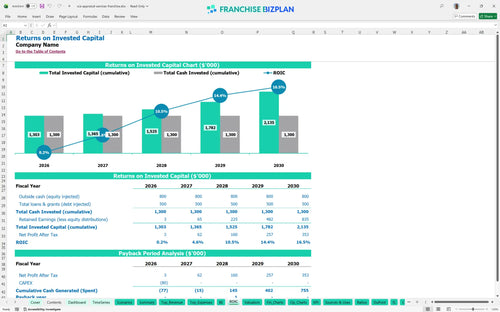
The model forecasts a 3-year payback period and an IRR (internal rate of return) of 7.41%. While the ROE (return on equity) stands at 1.04, the real value lies in the steady cash flow growth, reaching $438,000 in EBITDA by Year 5. Estimating ROI for mobile service franchise units requires looking past the first 12 months of setup.
Monthly break-even occurs in month 3, driven primarily by the low 5% royalty and manageable fixed costs of $5,000 per month. Reaching this milestone depends on hitting your initial volume targets for complex appraisals and claims processing. Every inspection counts when you are covering a $50,000 manager salary from day one.
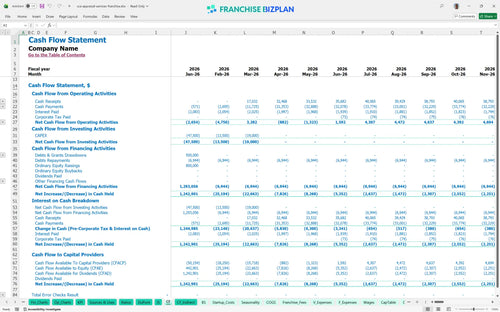
Your lowest cash point is projected for December 2027 at $1,154,000, suggesting you need a substantial buffer for long-term operations. To be fair, this includes your initial investment and cumulative working capital needs during the ramp-up. If opening takes 90+ days longer than planned, working capital pressure rises quickly.
Shifting between scenarios changes your Year 1 margin of 11.2% and your peak cash needs. A High case scenario, driven by better local marketing execution and higher average tickets for industrial appraisals, could significantly shorten that 3-year payback. Use the Excel template for franchise financial forecasting to toggle these growth rates.
Finance: update unit break-even and payback model by Friday.
This franchise financial model template provides a flexible foundation for mapping out your appraisal business in Excel. You can adjust pre-filled formulas for revenue drivers like complex appraisals or claims processing to see how volume shifts impact your bottom line. It's built to handle local market variables, from area-specific rent to varying technician headcounts as you scale. Honestly, having editable assumptions means you can stress-test your unit economics before signing a lease.

Planning for a service-based franchise unit profit and loss statement requires a long-term view of how margins evolve as you move from $375,000 in Year 1 to $1,050,000 by Year 5. This model tracks the transition from a lean startup to a mature unit with $438,000 in annual EBITDA (earnings before interest, taxes, depreciation, and amortization). It defintely helps you visualize the cash flow bridge needed to sustain operations during the initial ramp-up phase. One clean one-liner: long-term success depends on scaling your tech team alongside your contract volume.

Managing franchise royalty fees and operational costs is simplified with dedicated inputs for the 5% royalty and 0% marketing fund contributions. By baking these into your franchise business plan excel, you see exactly how much gross revenue stays in the unit after the franchisor takes their cut. The model accounts for the $40,000 initial franchise fee as a Day 1 capital outlay, ensuring your ROI (return on investment) calculations are grounded in reality. Plus, tracking the royalty fee calculation monthly prevents any surprises during your first year of trading.

Estimating how to calculate startup costs for a service franchise is critical for securing financing or personal capital. This tool aggregates your $80,000 initial CAPEX (capital expenditure), including $15,000 for mobile vehicles and $8,000 for office improvements. The break-even analysis shows you exactly when monthly revenue covers your $2,200 rent and $2,800 in other fixed monthly operational overhead. Still, the speed of your ramp-up depends heavily on how fast you close those first priority contracts.

This franchise financial projection spreadsheet includes benchmarks for labor and COGS (cost of goods sold) to keep your planning realistic. For instance, inspection materials start at 3.5% of revenue, while travel expenses are pegged at 2.5%. Comparing these to your actuals helps identify margin leaks in your mobile service units before they become systemic issues. Financial planning for heavy equipment appraisal businesses is about precision, not guesswork.


Simply purchase and download the financial model template, then access it instantly using Microsoft Excel or Google Sheets. No installation or technical expertise required-just open and start working.

Enter your business-specific numbers, including revenue projections, costs, and investment details. The pre-built formulas will automatically calculate financial insights, saving you time and effort.

Leverage the investor-ready format to confidently showcase your financial projections to banks, franchise representatives, or investors. Impress stakeholders with clear, data-driven insights and professional reports.

Leverage the investor-ready format to confidently present your projections to banks, franchise representatives, or investors.