
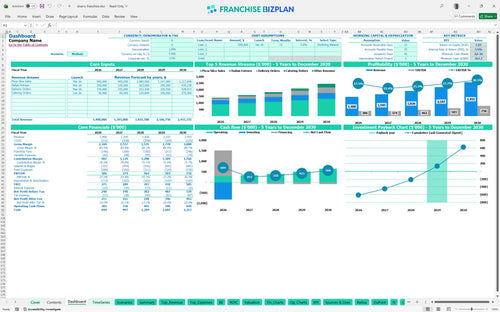
All-in-one Dashboard
Core inputs and core outputs


This comprehensive tool includes a pizza shop profit and loss projection, capital expenditure budget, and detailed unit economics to guide your investment decision from day one through year five.
Core inputs and core outputs
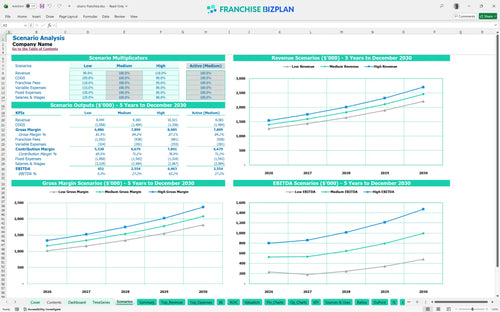
Three scenario analysis
Presentation ready
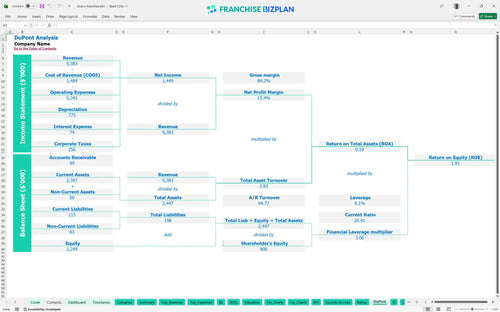
DuPont analysis
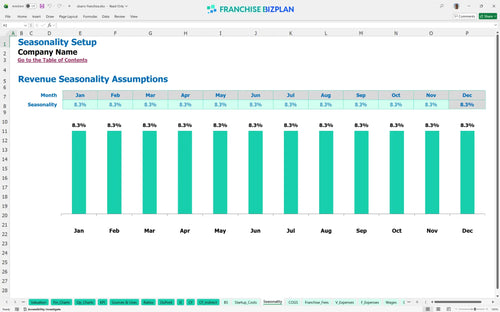
Researched revenue assumptions
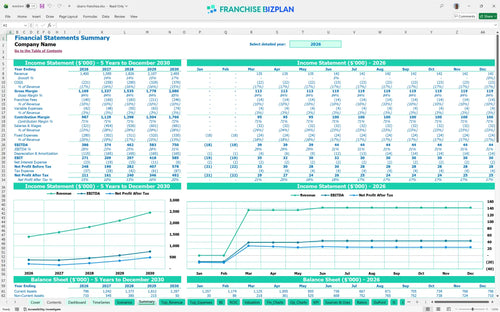
Lender-friendly financial outputs
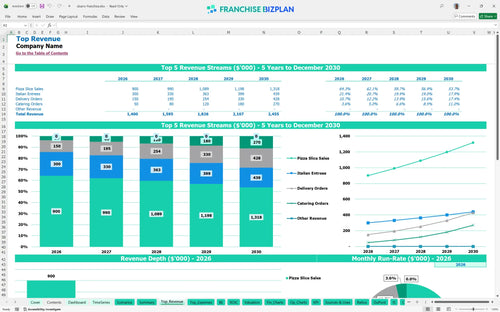
Revenue stream detailed view
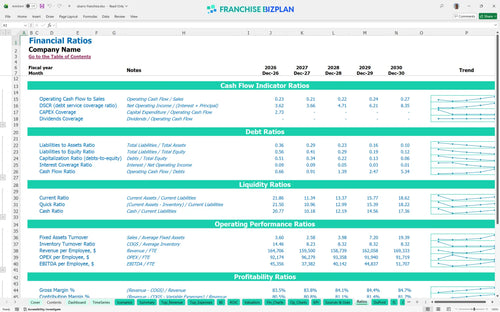
Performance metrics benchmark
We built this franchise unit financial model using our own research to provide a realistic roadmap for operators. Key assumptions like the $1.4 million year-one revenue and the $350,000 leasehold budget are pre-populated with researched data specific to this pizza franchise and are fully editable. This tool helps you visualize how the 7% royalty and 3% marketing fees interact with your store-level margin as you scale.
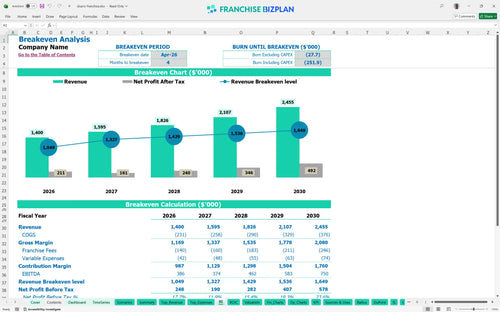
The model shows this pizza franchise reaches its breakeven date in April 2026, just four months after launching. By year five, EBITDA climbs to $750,000 as you scale catering and delivery. This assumes you manage the 14.5% food cost and 7% royalty burden effectively while growing the top line.
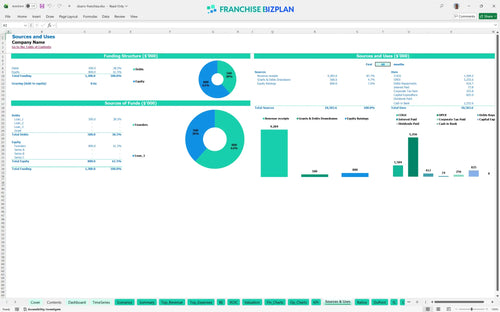
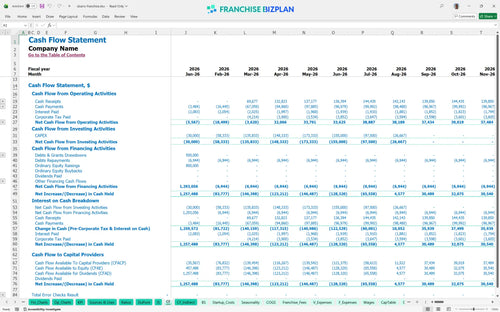
You will need significant upfront liquidity to cover the $825,000 in initial CAPEX plus a working capital buffer. The lowest cash point hits $564,000 in July 2026. This covers everything from the $30,000 franchise fee to the $150,000 pizza ovens and $350,000 for leasehold improvements during the build-out.
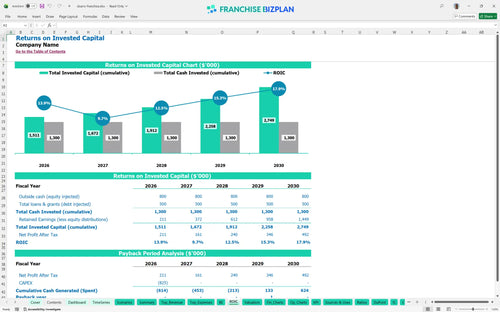
The ROI analysis for fast-casual restaurant franchise shows an IRR of 3.9% and a Return on Equity of 1.81. You are looking at a 4-year payback period to recoup your initial investment. While the first year EBITDA is $386,000, the real value builds as revenue crosses the $2.1 million mark in year four.
To cover your $15,000 rent and $24,400 in other monthly fixed costs, you need to hit your stride by month four. The franchise unit financial feasibility study indicates that pizza slice sales are the main driver, projected at $600,000 in year one. If traffic dips, the high fixed rent on a prime corridor becomes a major risk to your margin.
Your lowest cash point is $564,000 in July 2026, which is about five months after the March launch. This is the danger zone where construction tail costs and initial payroll hit before the revenue ramp is fully mature. You defintely want a six-month buffer to handle any delays in the $80,000 signage and kitchen install or permit holdups.
Estimating revenue for a high-traffic pizza franchise requires looking at Low, Medium, and High cases. A 10% drop in slice volume could push your payback past five years, while hitting the High case with $270,000 in catering by year five significantly boosts your operational cash flow. The model lets you toggle these levers to see the impact on your $750,000 year-five EBITDA.
This franchise unit financial model is fully customizable in Excel, giving you total control over the numbers. You get pre-filled formulas and editable assumptions for everything from pizza slice volume to local labor rates, making it easy to adapt the plan to your specific territory or a high-traffic mall location. It is the fastest way to see how different pricing or staffing levels impact your bottom line without building a sheet from scratch.

Long-term planning is vital for any restaurant franchise business plan. This model provides a detailed 5-year look at revenue, costs, and cash flow to help you see the big picture. Since Year 1 revenue starts at $1,400,000 and scales to over $2,455,000 by Year 5, you need to see how margins evolve as your team gets faster and food waste drops. It maps out the transition from a new opening to a mature, high-performing unit.

The model tracks your ongoing obligations like the 7% royalty and 3% marketing fund so there are no surprises. These franchise royalty fees are calculated automatically against your gross sales, ensuring you see the exact impact on your operational cash flow. Understanding these costs upfront helps you see the real economics of the unit before you sign the franchise agreement or commit to a lease.

Use the franchise investment calculator to estimate your total initial outlay, including the $30,000 franchise fee and $350,000 for leasehold improvements. The model shows you exactly what sales volume you need to hit to cover your $15,000 monthly rent and other fixed costs. Knowing how to calculate startup costs for a pizza franchise helps you secure financing and manage your initial capital more effectively.

This model includes built-in benchmarks to help you perform a franchise profitability analysis that reflects real-world standards. For example, food cost percentage starts at 14.5% and trends down to 13.3% as you optimize your kitchen operations. Comparing your labor and occupancy costs against these standards ensures your projections stay grounded in reality and helps you spot potential margin leaks early.


Simply purchase and download the financial model template, then access it instantly using Microsoft Excel or Google Sheets. No installation or technical expertise required-just open and start working.

Enter your business-specific numbers, including revenue projections, costs, and investment details. The pre-built formulas will automatically calculate financial insights, saving you time and effort.

Leverage the investor-ready format to confidently showcase your financial projections to banks, franchise representatives, or investors. Impress stakeholders with clear, data-driven insights and professional reports.

Leverage the investor-ready format to confidently present your projections to banks, franchise representatives, or investors.