
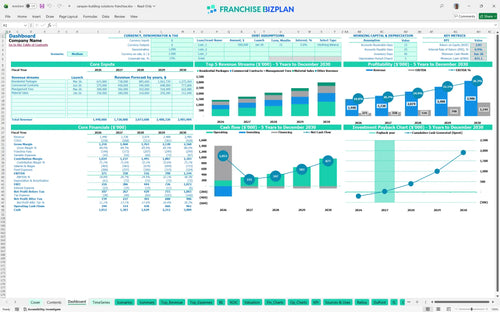
All-in-one Dashboard
Core inputs and core outputs


This franchise unit financial model template includes a comprehensive Excel-based framework for projecting revenue, expenses, and multi-year cash flows for a high-end building solutions showroom.
Core inputs and core outputs
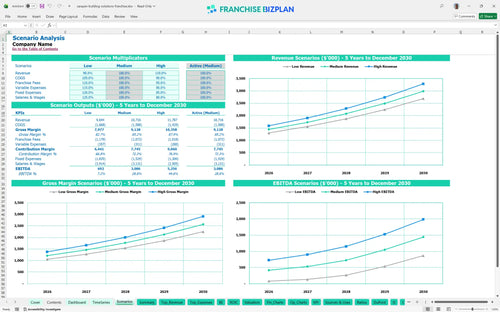
Three scenario analysis
Presentation ready
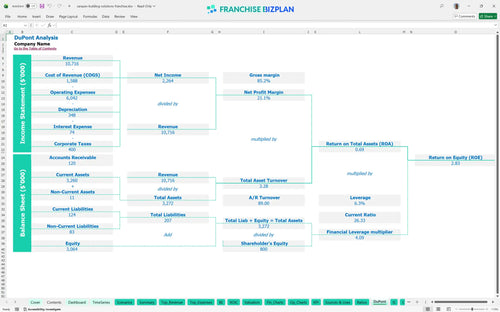
DuPont analysis
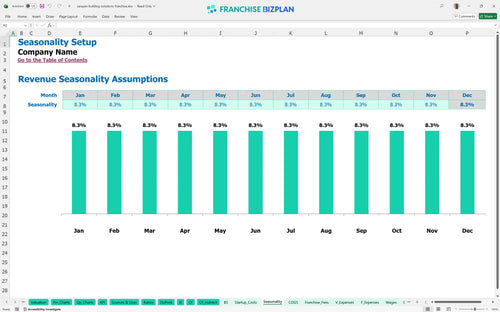
Researched revenue assumptions
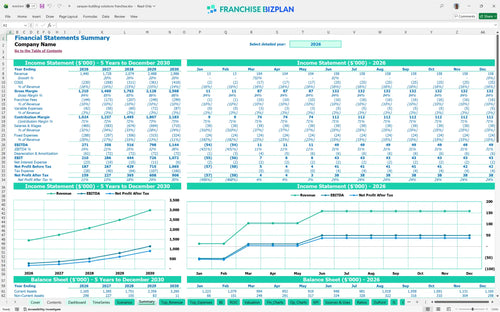
Lender-friendly financial outputs
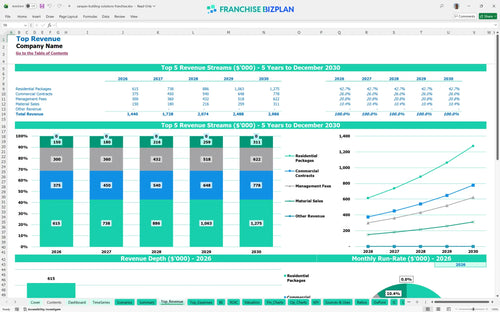
Revenue stream detailed view
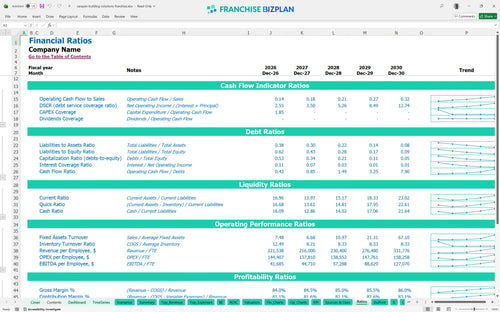
Performance metrics benchmark
We built this franchise unit financial projection using researched data to provide a realistic view of the franchise unit economics. The model includes pre-populated assumptions for $1.44M in year-one revenue and a 4-month path to break-even, all of which are fully editable to fit your specific market. This tool gives you the data-driven confidence needed to evaluate the building solutions opportunity.
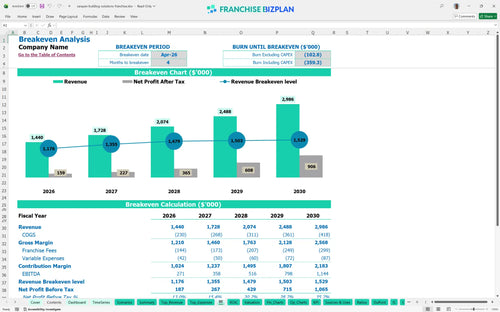
This unit reaches profitability in its first year, generating $271,000 in EBITDA (Earnings Before Interest, Taxes, Depreciation, and Amortization) on $1.44M in sales. By year five, EBITDA scales to $1.14M as revenue grows to $2.98M and eco-friendly material costs drop from 11.5% to 9.5%. This sustainable building franchise profitability analysis shows a strong upward trajectory as the unit matures.
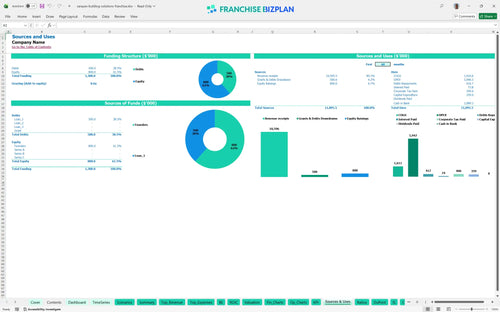
Launching this unit requires a $359,000 CAPEX (Capital Expenditure, or money spent on physical assets) budget for the build-out and equipment. These startup financial projections for home improvement franchise operations also account for a $831,000 minimum cash position to ensure you survive the initial ramp-up phase. Total initial investment covers everything from the franchise fee to the smart home demo systems.
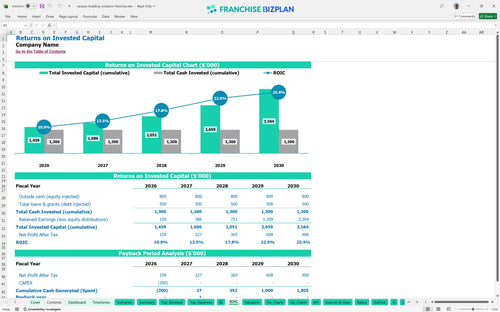
Investors can expect a 6.86% IRR (Internal Rate of Return) and a 2.83 ROE (Return on Equity) over the five-year projection period. The building franchise investment return projection shows a 2-year payback period, which is efficient for a high-end showroom model. This ROI analysis for franchise owners suggests a solid recovery of capital within the first 24 months of operation.
The monthly break-even point is reached in April 2026, just four months after starting material sales. Break-even depends heavily on managing the $24,000 in monthly fixed costs, with the $16,000 showroom rent being the largest single overhead item. Estimating operating costs for high-end franchise showroom locations is critical to maintaining this aggressive timeline.
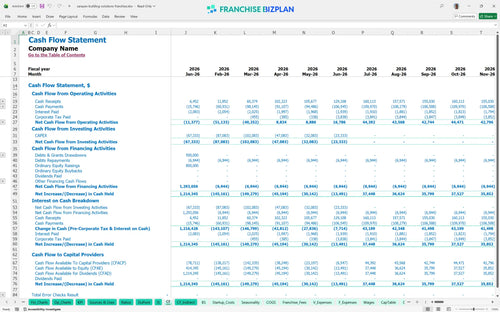
The lowest cash point occurs in June 2026 at $831,000, which serves as the critical financial forecasting tool for new franchise owners. You need to maintain this liquidity to cover the ramp-up phase before the unit becomes self-sustaining. Still, keeping a close eye on your $24,000 monthly fixed overhead is the best way to protect your runway.
The high scenario assumes revenue reaches $2.98M by year five, while the low case would see slower adoption of commercial contracts. This financial model for modular construction business shows that hitting the high case defintely requires aggressive local marketing in high-net-worth zip codes. Profitability timing and peak cash needs will shift significantly based on how quickly you scale your project management team.
Finance: update unit break-even and payback model by Friday.
This franchise financial model template is built in Excel with fully editable assumptions and pre-filled formulas, allowing you to adapt the projections to any territory or market condition. You can adjust revenue drivers, staffing levels, and local operating costs to see how changes impact your bottom line. It is a flexible Excel template for franchise unit financial planning that handles the heavy lifting of financial logic for you.

Planning for long-term success requires more than a one-year view, so this model provides a detailed 5-year profit and loss statement template. It tracks revenue growth from $1.44M in year one to nearly $3M by year five, helping you visualize the scaling process. This construction franchise business plan tool ensures you can project cash flow and balance sheet health over a multi-year horizon.

The model accurately captures franchise-specific costs like the 8% royalty and 2% marketing fund contributions to show you the true store-level margin. By using this franchise business model financial spreadsheet, you can see exactly how these fees impact your monthly cash flow. It ensures that every dollar paid to the franchisor is accounted for before you calculate your take-home pay.

This franchise startup cost calculator helps you estimate the total initial investment, including the $140,000 showroom build-out and $60,000 in technology. It provides a clear view of how to calculate startup costs for a construction franchise, identifying the exact sales volume needed to cover your $24,000 in monthly fixed overhead. Knowing your break-even point is the first step toward a sustainable operation.

We have integrated industry-specific benchmarks to help you sanity-check your labor costs and gross margins against typical construction and showroom standards. This is essential for budgeting for LEED-certified construction business operations, where specialized staff like Project Managers and LEED-trained designers are required. Comparing your projections to these benchmarks helps ensure your business plan remains realistic and achievable.


Simply purchase and download the financial model template, then access it instantly using Microsoft Excel or Google Sheets. No installation or technical expertise required-just open and start working.

Enter your business-specific numbers, including revenue projections, costs, and investment details. The pre-built formulas will automatically calculate financial insights, saving you time and effort.

Leverage the investor-ready format to confidently showcase your financial projections to banks, franchise representatives, or investors. Impress stakeholders with clear, data-driven insights and professional reports.

Leverage the investor-ready format to confidently present your projections to banks, franchise representatives, or investors.