
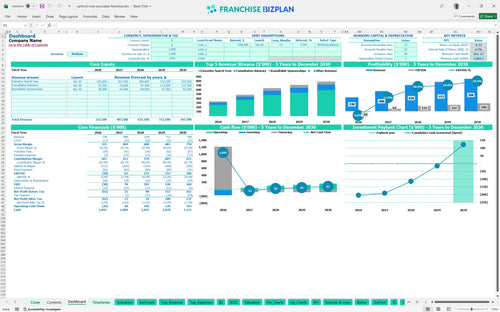
All-in-one Dashboard
Core inputs and core outputs


This executive search franchise financial model excel template provides a detailed roadmap for estimating revenue for executive search firms and managing the specific overhead of a professional services office.
Core inputs and core outputs
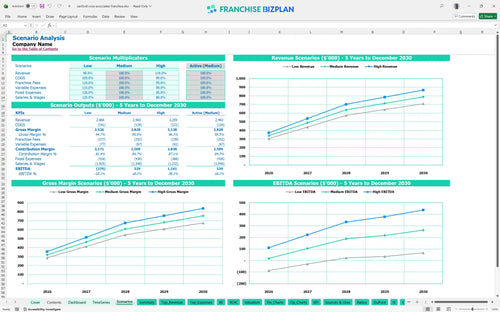
Three scenario analysis
Presentation ready
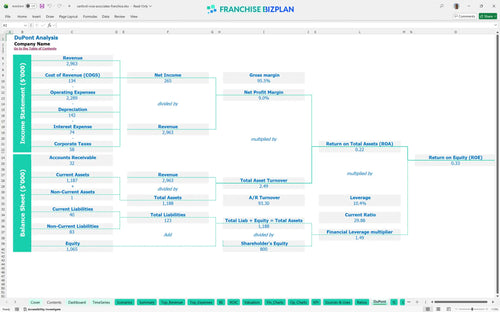
DuPont analysis
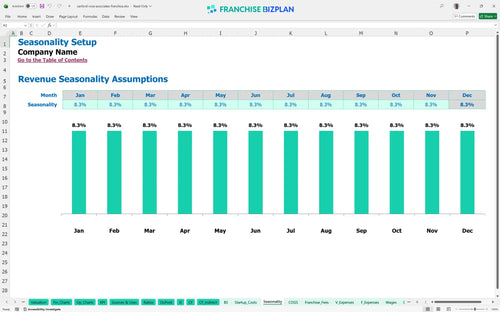
Researched revenue assumptions
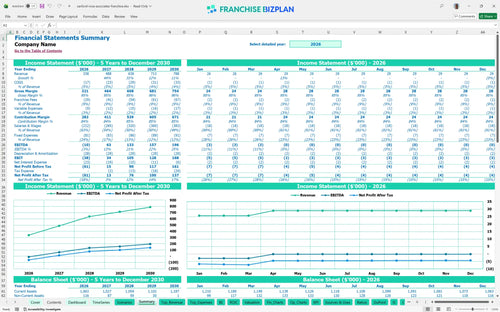
Lender-friendly financial outputs
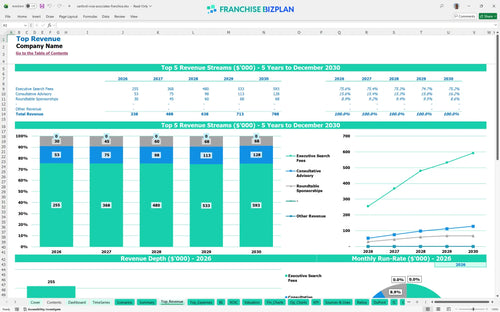
Revenue stream detailed view
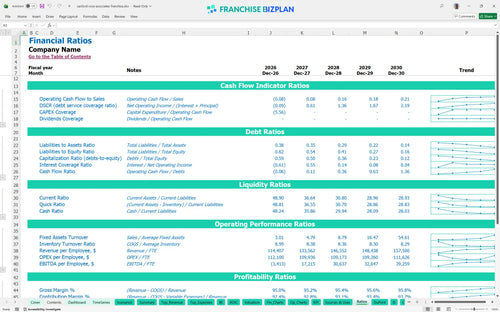
Performance metrics benchmark
We built this franchise unit financial model using our own research into the professional search sector. The pre-populated assumptions cover everything from $338,000 in year-one revenue to specific $85,000 salaries for recruiters, and they are all fully editable to match your local market. Here is the quick math: with a 5-year payback, you need to watch your margins closely from day one.
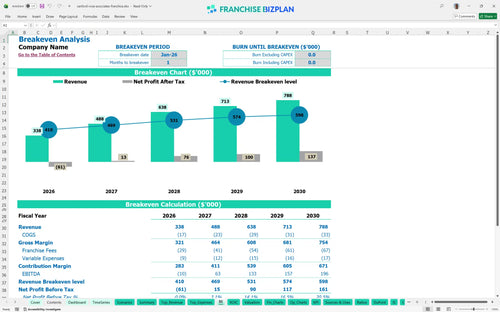
This unit hits positive EBITDA in year two, reaching $63,000 after a small initial loss. By year five, the model projects a net profit based on $788,000 in total revenue across search fees and advisory work. Profitability depends on scaling your researcher and business development headcount to keep the placement funnel full.
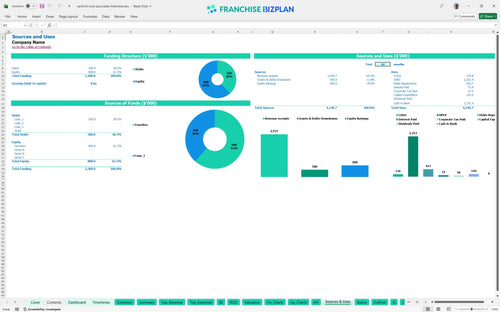
You will need roughly $143,580 in initial capital to cover the franchise fee, office build-out, and equipment. The model also accounts for a minimum cash requirement of over $1 million to sustain operations through the ramp-up period. Most of your initial cash goes toward the brand rights and setting up your physical office along a major corporate corridor.
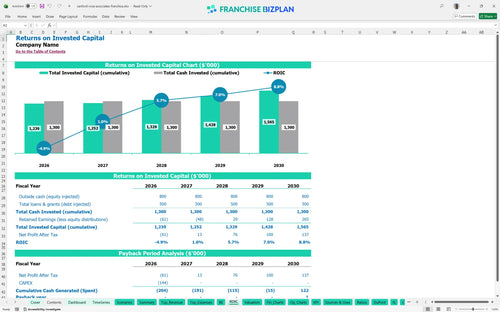
Investors can expect an IRR of 2.54% and a 5-year payback period for this specific unit. While the initial return seems modest, the ROE of 0.33 shows steady equity building as the firm matures. To be fair, the real value lies in the long-term cash flow once the initial investment is fully recouped.
The unit reaches its break-even date in January 2026, just one month after launch, assuming you hit your initial search fee targets. The primary driver for staying above water is the volume of executive search fees, which must cover the $6,750 in monthly fixed costs. If your search cycle takes longer than expected, your cash burn will increase.
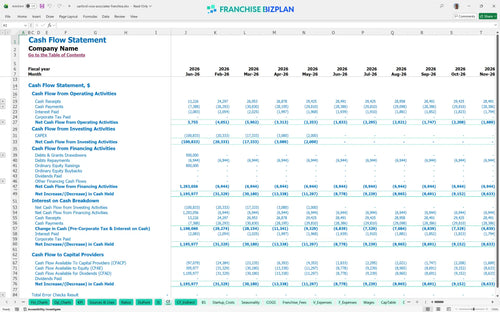
The lowest cash point occurs in December 2027, requiring a significant reserve to handle the timing gaps between placements and payroll. You need a deep runway because executive search has lumpy cash flows compared to a retail business. Still, keeping a buffer is essential to survive the months where no searches close.
A high-performance scenario significantly shortens the 5-year payback and boosts the year-one margin by increasing the average search ticket. Conversely, a low scenario where revenue drops by 20% would likely push the break-even point much further out and increase peak cash needs. Financial forecasting for new franchise units must account for these swings in placement speed.
Finance: update unit break-even and payback model by Friday
This franchise unit financial model template is built in Excel, giving you total control over every variable from desk fees to headcounts. You can swap out the pre-filled data for your specific territory or local market conditions without breaking the math. It's a flexible tool that handles the heavy lifting so you can focus on the actual executive search franchise opportunity.

Mapping out a recruitment franchise business plan requires a long-term view of how search fees and advisory revenue scale over time. This model provides a full 5-year outlook, showing how your EBITDA grows from a slight year-one dip to nearly $196,000 by year five. It defintely helps you see the forest for the trees when planning your expansion.

Understanding franchise royalty and fee structures is critical because these off-the-top costs directly impact your take-home pay. We've baked in the 8% royalty and 0.5% marketing fund contributions so you can see exactly how much cash stays in the business. This transparency ensures you aren't surprised by the brand's cut as your billings increase.

Knowing how to calculate startup costs for a recruitment franchise is the first step to avoiding a cash crunch. This model aggregates your initial $88,000 fee with build-out and equipment costs to show your total entry price. We track the path to your break-even date in January 2026, so you know exactly when the unit stops burning and starts earning.

We use real-world recruitment agency profitability data to set realistic guardrails for your projections. By comparing your labor costs and rent against industry standards, you can sanity-check if your $3,000 monthly office lease fits the model. It's about making sure your executive search franchise financial model excel template stays grounded in reality.


Simply purchase and download the financial model template, then access it instantly using Microsoft Excel or Google Sheets. No installation or technical expertise required-just open and start working.

Enter your business-specific numbers, including revenue projections, costs, and investment details. The pre-built formulas will automatically calculate financial insights, saving you time and effort.

Leverage the investor-ready format to confidently showcase your financial projections to banks, franchise representatives, or investors. Impress stakeholders with clear, data-driven insights and professional reports.

Leverage the investor-ready format to confidently present your projections to banks, franchise representatives, or investors.