
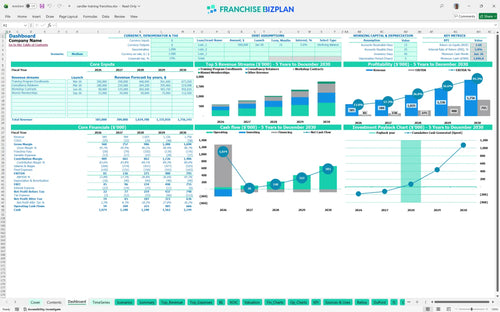
All-in-one Dashboard
Core inputs and core outputs


This comprehensive financial tool provides a dynamic 5-year roadmap for managing startup costs, operational expenses, and long-term revenue growth for a professional services training unit.
Core inputs and core outputs
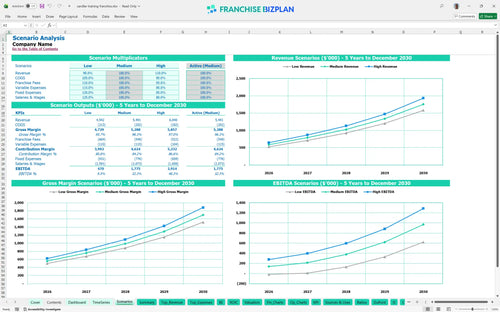
Three scenario analysis
Presentation ready
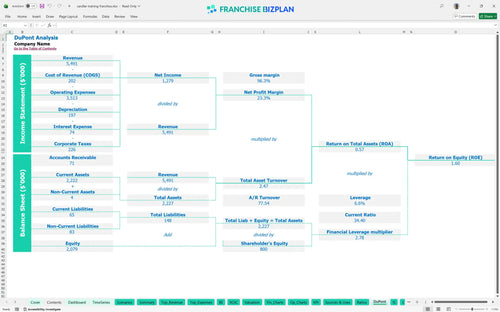
DuPont analysis
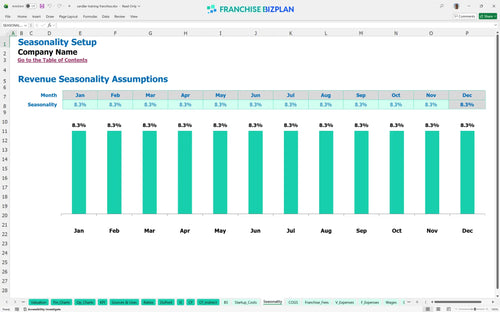
Researched revenue assumptions
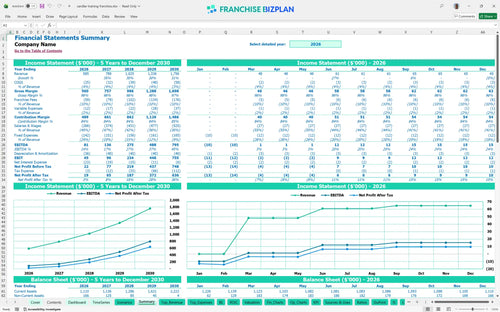
Lender-friendly financial outputs
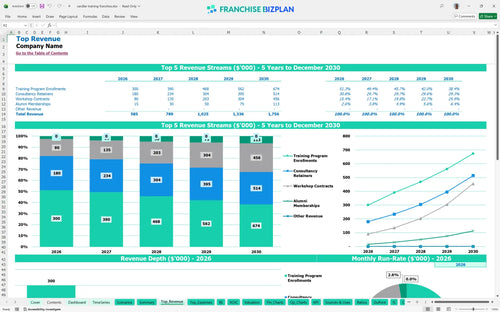
Revenue stream detailed view
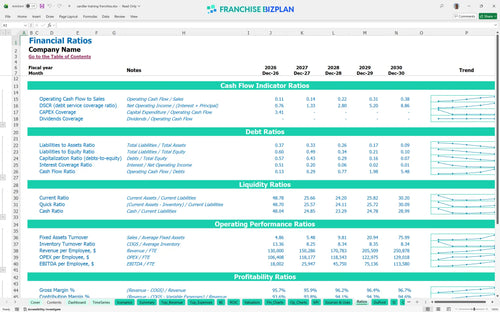
Performance metrics benchmark
We built this financial model for B2B sales training franchise unit using detailed research on professional service territories. The assumptions for revenue streams, like the $200,000 Year 1 training enrollments, and expenses like the $90,000 Center Director salary are pre-populated and fully editable. With an initial Year 1 EBITDA of $81,000, this model provides a pragmatic baseline for your franchise unit financial planning.
The unit reaches profitability in its first year, generating $81,000 in EBITDA by December 2026. Here's the quick math: after accounting for 8% royalties, 2% marketing fees, and $11,750 in monthly fixed costs, the high margins on consultancy retainers drive the bottom line. You will see net profit climb significantly by Year 3 as revenue exceeds $1 million.
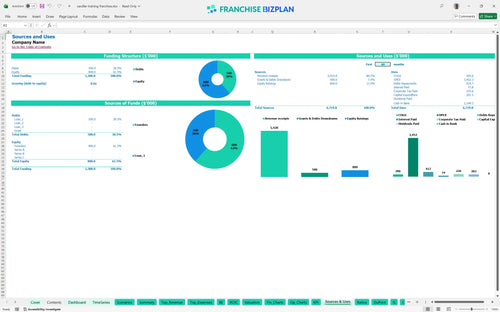
To launch this unit in the US, you need approximately $201,500 in upfront capital for fixed assets and fees. This includes the $59,000 franchise fee and $55,000 for leasehold improvements in a prime location. Understanding how to calculate startup costs for a sales coaching franchise is vital, as pre-opening costs and the initial cash buffer protect you during the three-month ramp-up.
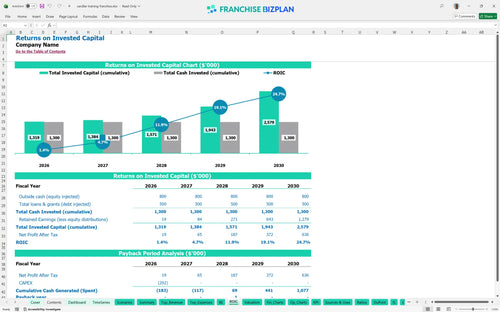
Investors can expect an Internal Rate of Return (IRR) of 5.84% and a Return on Equity (ROE) of 1.6. The payback period is 3 years, which is standard for a professional services model with moderate CAPEX. The return on investment for franchises in this sector depends heavily on maintaining the 5-year revenue growth trajectory from $585,000 to $1,756,000.
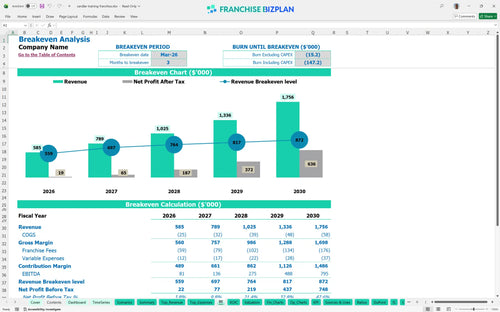
The monthly break-even point is reached in March 2026, just three months after launching training programs. The primary driver for this quick turnaround is the low variable cost structure, though the $8,500 monthly rent creates a high fixed-cost floor. Using a franchise unit profitability analysis tool helps you monitor the 22% combined labor and rent burden that dictates your daily survival.
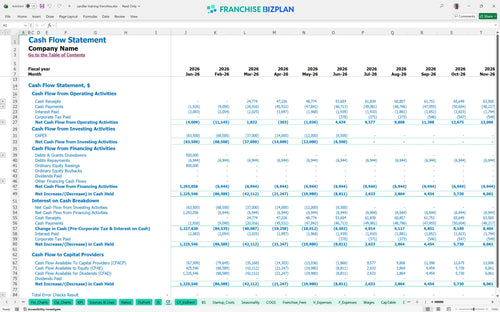
The lowest cash point occurs in June 2026, with a minimum cash balance of $1,047,000. While the model shows a strong cash position, you need at least six months of runway to cover the $11,750 in monthly fixed expenses plus payroll. Still, keeping a buffer is smart if workshop contracts lag. Managing the startup cost spreadsheet for sales consultancy franchise units requires tight control over timing gaps.
The difference between the High and Low scenarios hinges on your ability to scale from $585,000 to $1.756 million in annual sales. Predicting revenue for a professional services franchise is sensitive to the number of lead trainers; adding trainers in Year 2 is necessary to support the 35% revenue jump. A High scenario shortens payback, while the Low scenario may extend it beyond 48 months.
Finance: update unit break-even and payback model by Friday.
This franchise unit financial model is fully customizable in Excel, featuring pre-filled formulas and editable assumptions that adapt to your specific territory and operating scenario. You can easily adjust the franchise business plan Excel to reflect local market conditions, ensuring your projections remain grounded in reality rather than generic estimates.

Plan for sustainable growth with a detailed 5-year franchise profitability projection that covers revenue, costs, cash flow, and net income. This long-term view helps multi-unit operators and solo franchisees alike understand how the professional services model scales from initial launch to a mature training center.

The model accurately captures franchise-specific financial obligations, including the initial franchise fee and ongoing royalty payment forecasting. By modeling the 8% royalty and 2% marketing fund contributions, you can see exactly how these top-line deductions impact your store-level margin and bottom-line cash flow. This is essential for any franchise fee structure analysis.

Use the franchise startup cost analysis to estimate your total initial investment, including build-out, equipment, and working capital. The integrated franchise investment calculator determines the exact sales volume required to cover your $8,500 monthly rent and fixed payroll, providing a clear path to operational stability.

This model incorporates built-in franchise unit economics and industry benchmarks for professional services, allowing you to sanity-check your labor and occupancy costs. Comparing your projected performance against typical ranges for B2B training centers ensures your budget for a new franchise location is defintely realistic and defensible.


Simply purchase and download the financial model template, then access it instantly using Microsoft Excel or Google Sheets. No installation or technical expertise required-just open and start working.

Enter your business-specific numbers, including revenue projections, costs, and investment details. The pre-built formulas will automatically calculate financial insights, saving you time and effort.

Leverage the investor-ready format to confidently showcase your financial projections to banks, franchise representatives, or investors. Impress stakeholders with clear, data-driven insights and professional reports.

Leverage the investor-ready format to confidently present your projections to banks, franchise representatives, or investors.