
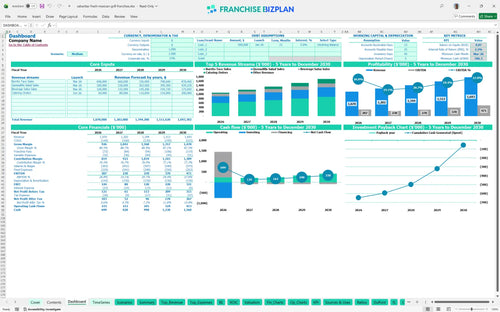
All-in-one Dashboard
Core inputs and core outputs


This Excel template for franchise unit financial projections provides a detailed, data-driven roadmap for estimating startup costs, monthly cash flow, and long-term ROI for a high-volume Mexican grill unit.
Core inputs and core outputs
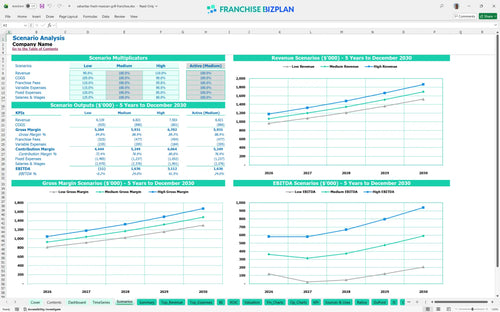
Three scenario analysis
Presentation ready
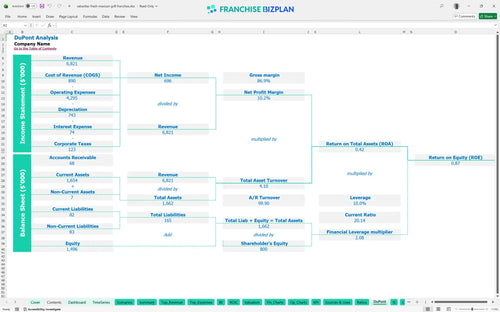
DuPont analysis
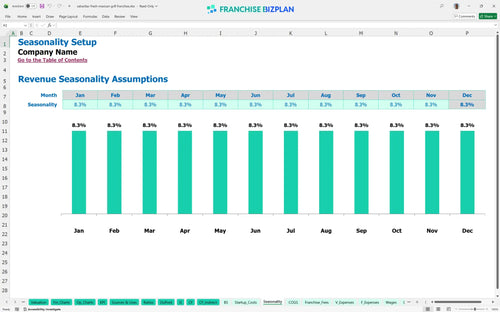
Researched revenue assumptions
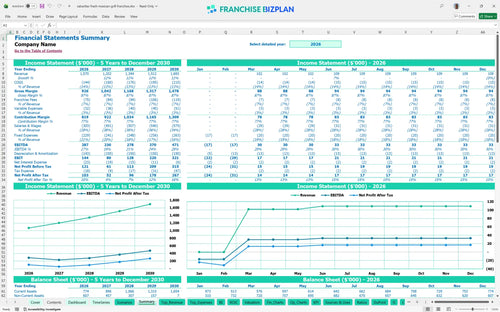
Lender-friendly financial outputs
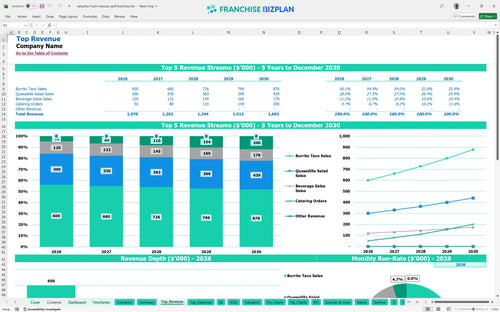
Revenue stream detailed view
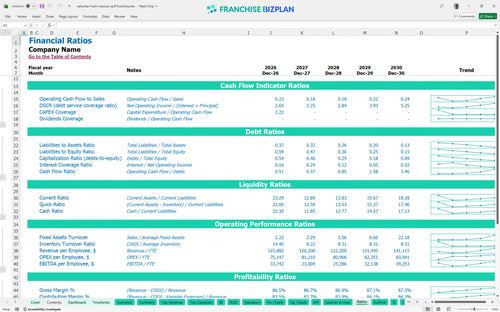
Performance metrics benchmark
We built this detailed financial model for food service franchise units using researched data to ensure your projections are grounded in reality. The model comes pre-populated with essential drivers like $400,000 in Year 1 taco sales and $14,000 monthly rent, but everything is fully editable to match your specific site. This is a practical financial planning guide for new franchise owners who need to see how $1.07M in starting revenue translates to bottom-line cash.
The unit shows a strong start with $287,000 in EBITDA during the first year, though it defintely dips to $230,000 in year two as you scale the team. By year five, the model projects a healthy $471,000 in annual earnings. Here's the quick math: your ability to manage the 12% food cost and 7% total franchise fees determines your final take-home pay.
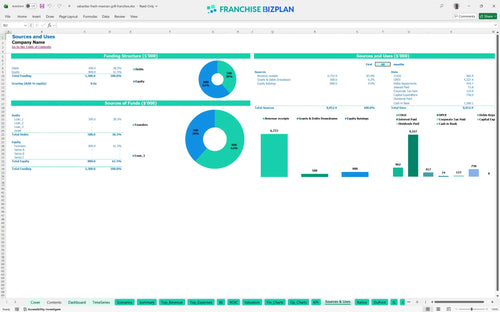
You will need approximately $750,000 in startup capital requirements to launch this unit. This covers the $30,000 initial fee and the heavy lifting of a $350,000 build-out. The model assumes you are opening in a prime location with high foot traffic, which requires significant upfront CAPEX (capital expenditure) for kitchen equipment and digital systems.
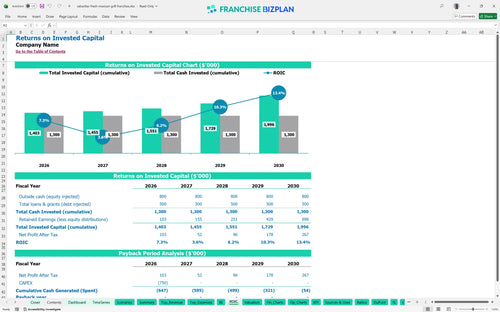
Evaluating return on investment for restaurant franchises requires a long-term lens; this model shows an IRR of 2.16% and a payback period that extends beyond year five. While the cash flow is steady, the high initial build-out costs mean you are playing for long-term equity and consistent annual distributions rather than a quick exit. Still, the $471k EBITDA in year five offers a solid terminal value.
The franchise unit economic analysis spreadsheet shows a fast path to operational break-even, hitting the mark in just 4 months by April 2026. Because your fixed costs like rent ($14,000) and insurance are high, your break-even depends heavily on maintaining high throughput during the lunch rush and growing the catering side of the business.
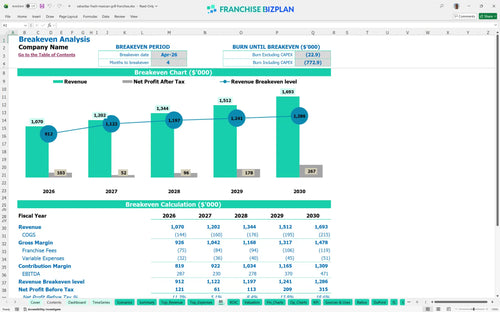
Your lowest cash point hits in March 2026 at $506,000, so you must have your financing locked down well before construction ends. The model suggests a healthy buffer is needed to survive the ramp-up phase before the catering revenue kicks in fully in June 2026. Managing your operating budget spreadsheet daily during the first 120 days is critical to protecting your liquidity.
A high-performance scenario relies on the catering specialist hitting the $200,000 revenue target by year five. If sales underperform by 15%, the 5% royalty and fixed $14,000 rent will squeeze margins quickly. This franchise unit profitability analysis helps you see how a $55 average catering ticket versus a $12 walk-in ticket changes your entire labor-to-revenue ratio.
Finance: update unit break-even and payback model by Friday.
This franchise financial model is built in Excel to give you total control over your numbers. All formulas are unlocked, so you can adjust the pre-filled assumptions for your specific territory, local labor rates, and actual lease terms. It is the fastest way to move from a generic estimate to a precise fast casual franchise business plan that reflects your market reality.

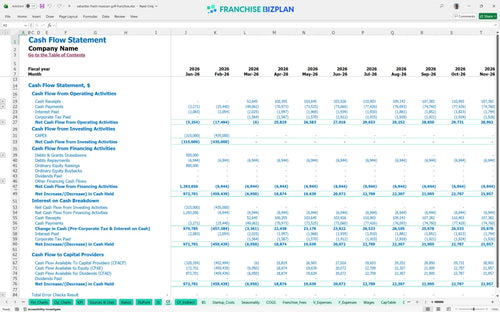
Success in food service requires looking past the grand opening. This tool provides a detailed 5-year outlook, mapping out how revenue scales from $1.07M in year one to over $1.69M by year five. It includes a full profit and loss, cash flow statement, and balance sheet to ensure your financial forecasting for restaurants is bank-ready and realistic.

Running a branded unit means managing specific off-the-top costs that eat into your margin. The model automatically calculates the 5% royalty and 2% marketing fund contributions based on your monthly sales. This ensures your restaurant franchise profit and loss statement template accounts for every dollar owed to the franchisor before you calculate your take-home pay.

Before you sign a lease, you need to know your total 'all-in' number. This Mexican restaurant investment model aggregates everything from the $30,000 initial fee to the $350,000 leasehold improvements. Calculating break even point for restaurant franchise operations becomes simple when you can see exactly how many burritos and tacos you need to sell to cover that $14,000 monthly rent.

Don't guess at your food costs or labor percentages. The model includes unit economics benchmarks, like food ingredients starting at 12% of sales, to help you sanity-check your projections. If your numbers vary wildly from these standards, you will know exactly where to dig in and optimize your store-level margin.


Simply purchase and download the financial model template, then access it instantly using Microsoft Excel or Google Sheets. No installation or technical expertise required-just open and start working.

Enter your business-specific numbers, including revenue projections, costs, and investment details. The pre-built formulas will automatically calculate financial insights, saving you time and effort.

Leverage the investor-ready format to confidently showcase your financial projections to banks, franchise representatives, or investors. Impress stakeholders with clear, data-driven insights and professional reports.

Leverage the investor-ready format to confidently present your projections to banks, franchise representatives, or investors.