
All-in-one Dashboard
Core inputs and core outputs


This comprehensive restaurant franchise investment calculator provides a structured Excel template for projecting revenue, managing operating expenses, and calculating long-term ROI for a new salad bar location.
Core inputs and core outputs
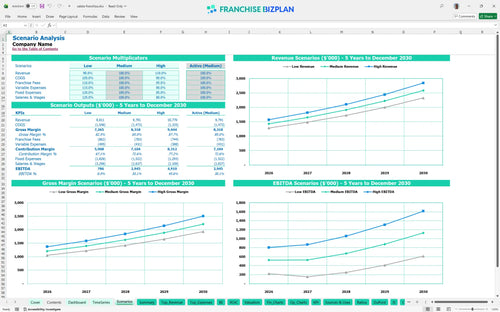
Three scenario analysis
Presentation ready
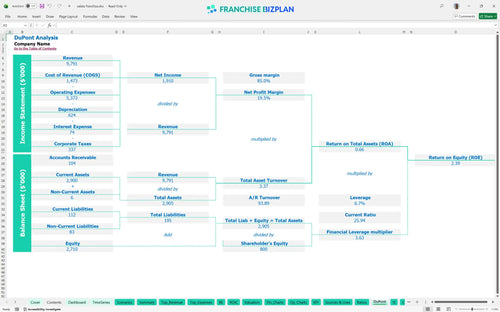
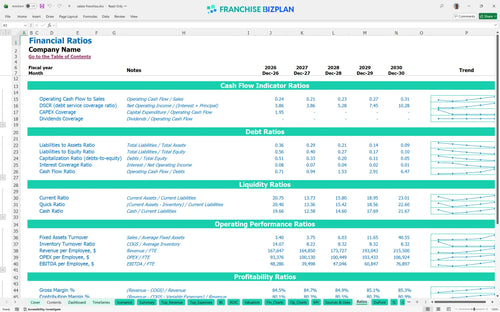
DuPont analysis
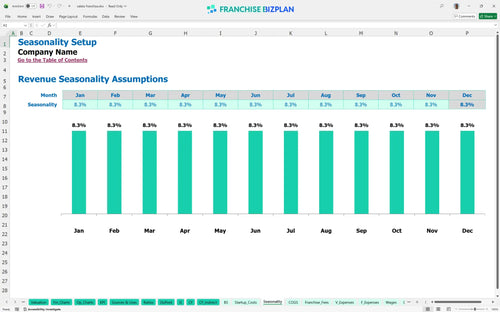
Researched revenue assumptions
Lender-friendly financial outputs
Revenue stream detailed view
Performance metrics benchmark
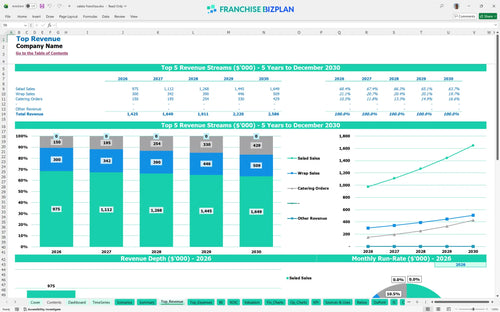
We built this franchise unit financial model using detailed research on the fast-casual healthy eating sector. Key assumptions, including the $1.425 million year-one revenue target and the 8% total royalty and marketing burden, are pre-populated and fully editable to reflect your specific market conditions. This tool ensures you have a data-driven business plan before signing a lease or committing capital.
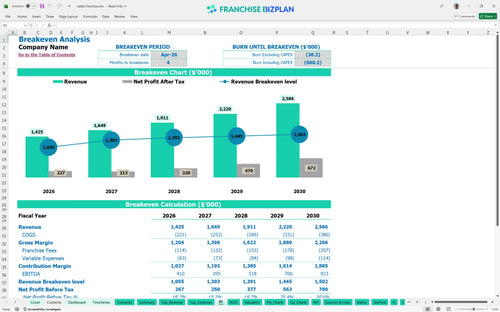
This unit becomes profitable in April 2026, just four months after the initial launch. With a year-one EBITDA of $410,000, the model shows that the high throughput of salad and wrap sales quickly offsets the initial startup and operating hurdles.
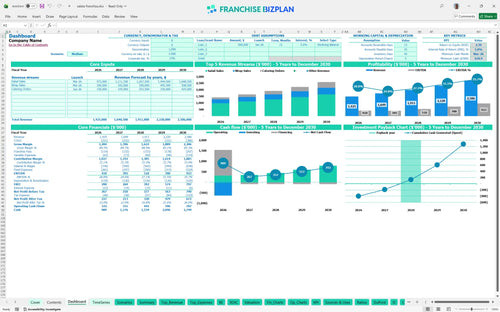
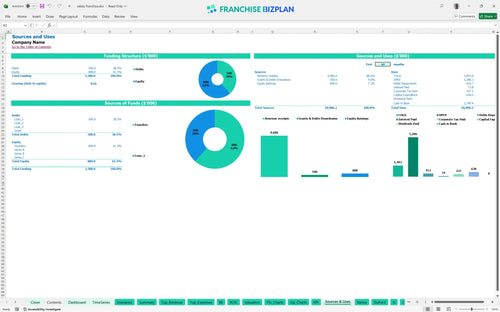
You need approximately $630,000 to launch this unit, covering everything from the $40,000 franchise fee to $350,000 in leasehold improvements. This total investment ensures the facility can handle the rapid assembly and high-volume catering required for the Midtown market.
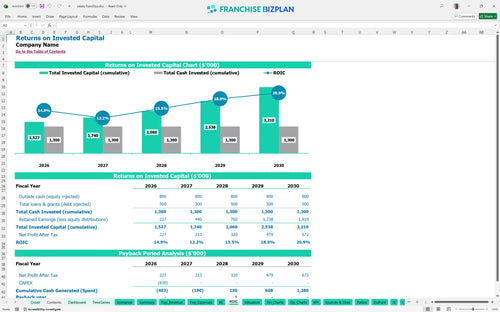
Investors can expect a 5.02% internal rate of return and a 3-year payback period on their initial capital. While the upfront costs are significant, the 2.39 return on equity demonstrates the long-term value of a well-located, high-traffic salad franchise unit.
The monthly break-even point is reached in month four, provided you maintain a steady volume of salad and wrap sales. The primary driver for break-even is managing the $18,000 monthly rent, which requires high daily traffic and efficient throughput during lunch rushes.
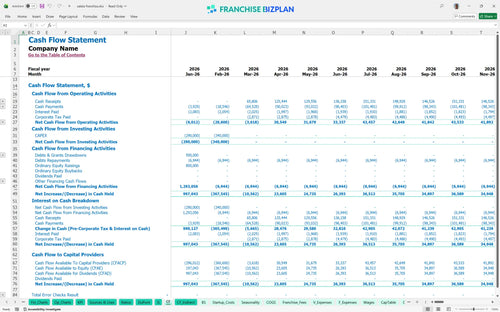
The lowest cash point occurs in March 2026 at $619,000, which is the first month of operations. You defintely need to maintain a cash buffer during the build-out phase to handle the gap between paying for equipment and seeing your first catering revenue.
In a high-growth scenario, year-five EBITDA can reach $923,000, significantly shortening the payback period. However, if revenue underperforms by 10%, the 5.02% IRR could dip, making local marketing and fitness studio partnerships essential for maintaining traffic.
Finance: update unit break-even and payback model by Friday
This franchise unit financial model is fully customizable in Excel, allowing you to adjust every driver from salad bowl pricing to hourly crew wages. The pre-filled formulas and editable assumptions make it simple to test different operating scenarios for your specific territory or real estate site.

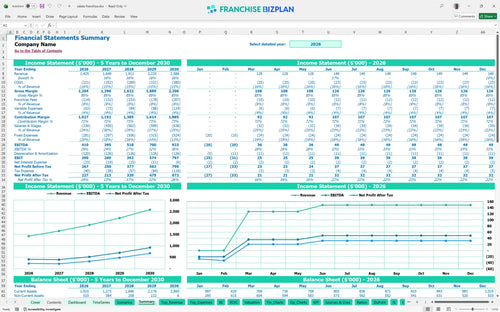
Plan for long-term growth with a detailed 5-year outlook that tracks revenue scaling from $1.425 million in year one to over $2.58 million by year five. This view helps multi-unit operators see the timing of cash flows and the impact of maturing store performance on the bottom line.

The model accurately captures your ongoing financial obligations, including the 5% royalty and 3% marketing fund contributions that come off the top. By modeling these fees against projected sales, you can see exactly how much margin remains to cover your local rent and labor.

Estimate your total initial investment, including the $630,000 required for build-out, equipment, and fees, to determine your exact path to profitability. The model identifies the specific sales volume needed each month to cover your fixed costs and start generating a return.

We have incorporated realistic industry benchmarks for a fast-casual salad concept, such as 13% ingredient costs and $18,000 monthly rent for prime locations. These figures allow you to sanity-check your projections against typical performance standards for high-volume food service units.


Simply purchase and download the financial model template, then access it instantly using Microsoft Excel or Google Sheets. No installation or technical expertise required-just open and start working.

Enter your business-specific numbers, including revenue projections, costs, and investment details. The pre-built formulas will automatically calculate financial insights, saving you time and effort.

Leverage the investor-ready format to confidently showcase your financial projections to banks, franchise representatives, or investors. Impress stakeholders with clear, data-driven insights and professional reports.

Leverage the investor-ready format to confidently present your projections to banks, franchise representatives, or investors.