
All-in-one Dashboard
Core inputs and core outputs


This comprehensive Excel template provides a detailed financial model for new franchise location, including pro forma statements and unit economics for a healthy fast-casual concept.
Core inputs and core outputs
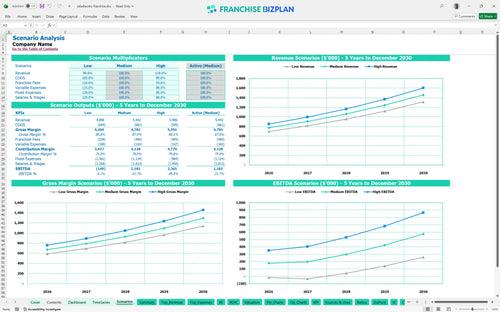
Three scenario analysis
Presentation ready
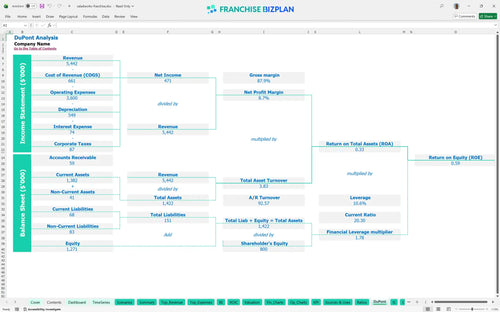
DuPont analysis
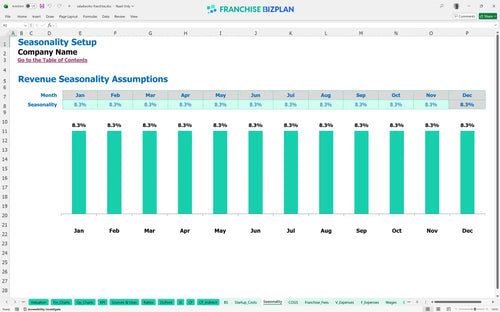
Researched revenue assumptions
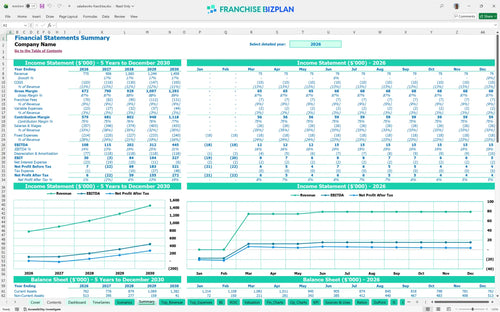
Lender-friendly financial outputs
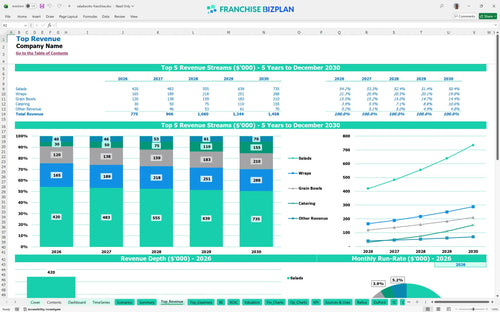
Revenue stream detailed view
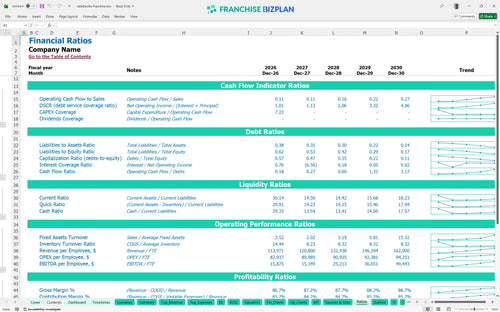
Performance metrics benchmark
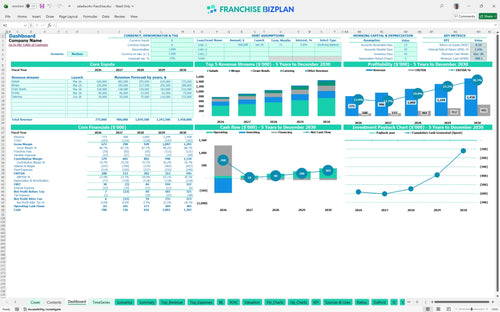
We built this franchise unit financial model using our own research to ensure it reflects the day-to-day reality of running a healthy fast-casual store. Key assumptions like your $775,000 year-one revenue and 6% royalty fees are pre-populated but fully editable to match your specific territory. This tool gives you a data-driven look at how catering and digital orders can push your EBITDA toward $445,000 by year five.
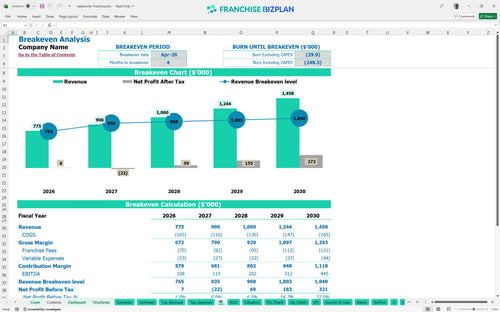
This unit is designed for a fast start, reaching its break-even point in April 2026, just four months after opening. While year one EBITDA is $108,000, the real momentum happens in years three through five as revenue clears the $1 million mark. Here's the quick math: keeping food costs under 12% is the key to staying in the black during that first year. Profitability depends on volume, but the margins are there if you execute.
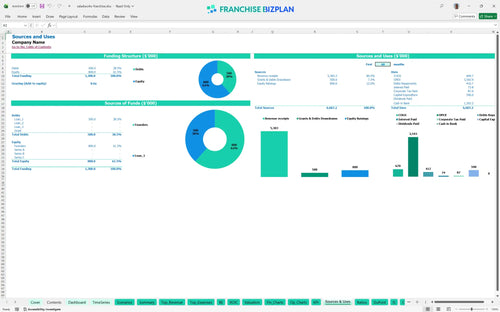
You will need a total initial investment that covers the $35,000 franchise fee and nearly $590,000 in hard costs like leasehold improvements and equipment. The biggest chunk is the $295,000 for build-out, plus another $120,000 for refrigeration and salad prep gear. What this estimate hides is the need for a significant cash buffer to handle the ramp-up phase. You should plan for your lowest cash point of $708,000 to occur around December 2026.
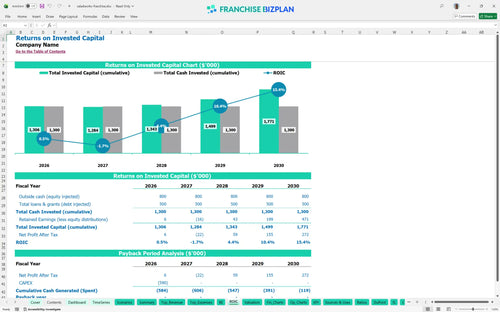
The ROI analysis for this unit shows an Internal Rate of Return (IRR) of 1.63% and a Return on Equity (ROE) of 0.59. While the unit generates strong annual EBITDA, the high initial build-out costs mean the full payback period extends beyond the first five years of operation. This is a long-term play focused on building a stable, cash-flowing asset rather than a quick flip. Still, the cash flow growth from $108k to $445k is a strong signal for multi-unit operators.
The monthly break-even point occurs in month four, driven largely by your ability to cover the $12,500 monthly rent and $15,000+ in management salaries. Your primary lever for hitting this goal is the daily salad and wrap volume, which accounts for over 70% of your initial revenue mix. If opening takes 90+ days longer than planned, your working capital pressure will rise significantly. Speed to market is your best friend here.
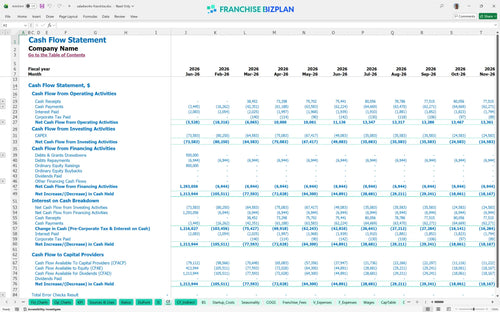
Your lowest cash point hits in December 2026 at $708,000, meaning you need to be well-capitalized from day one. The model suggests you have a solid runway, but you must manage the timing gaps between your $590,000 in upfront CAPEX and the ramp-up of your catering revenue. If you don't hit your year-two revenue target of $906,000, you may need to tighten the belt on non-essential maintenance. Cash is the lifeblood of the unit during the first 18 months.
In a high-growth scenario where revenue hits the $1.45M mark by year five, your EBITDA margin becomes very attractive for a multi-unit play. However, in a low-growth case, the high fixed costs of prime real estate and management salaries will defintely squeeze your net income. The difference between a 1.63% IRR and a double-digit return often comes down to how well you execute local marketing and digital pickup lanes. Small wins in average ticket size make a massive difference over 60 months.
This franchise financial model is an Excel-based tool designed to help you stress-test your assumptions before signing a lease. It includes editable fields for everything from your salad prep equipment to shift supervisor wages, so you can see how local rent impacts your bottom line. Honestly, the best part is that the formulas are already set, letting you focus on the strategy rather than the math. One-point margin leaks can sink a unit, so we made every cell adjustable.

Planning for a fast casual restaurant financial projections requires a long-term view of how your healthy food concept scales over time. This model maps out a five-year trajectory where revenue grows from $775,000 in the first year to over $1.45 million by year five. You can track how EBITDA margins expand as your team gets faster and your catering business gains local traction. Growth is rarely a straight line, but this roadmap helps you spot the curves.

Operating as part of a chain means you have fixed obligations that don't exist in independent shops, and our restaurant franchise royalty and marketing fee calculator handles this automatically. With a 6% royalty and a 3% marketing fee, you are looking at 9% of your top line going to the brand before you pay for a single head of lettuce. This model ensures these costs are baked into your monthly cash flow so there are no surprises when the bill comes due. Managing these fees is just part of the price for brand recognition.

Knowing how to calculate startup costs for a food franchise is the difference between a smooth opening and a mid-ramp cash crunch. This franchise startup cost template accounts for the $35,000 initial fee, $295,000 in leasehold improvements, and $120,000 for specialized kitchen equipment. We also include a break-even point calculation to show exactly when your daily salad and wrap volume covers your $12,500 monthly rent. Getting to zero is your first major milestone.

We have pre-loaded this model with data for estimating operating costs for a fast casual restaurant, using real-world numbers for food and labor. For example, food ingredients start at 11.5% of sales and drop to 9.5% as you improve portion control and waste management. These benchmarks help you see if your $65,000 manager salary or your $1,900 utility bill is in line with high-performing units in the healthy food space. If your numbers are way off the benchmark, it is time to dig into your operations.


Simply purchase and download the financial model template, then access it instantly using Microsoft Excel or Google Sheets. No installation or technical expertise required-just open and start working.

Enter your business-specific numbers, including revenue projections, costs, and investment details. The pre-built formulas will automatically calculate financial insights, saving you time and effort.

Leverage the investor-ready format to confidently showcase your financial projections to banks, franchise representatives, or investors. Impress stakeholders with clear, data-driven insights and professional reports.

Leverage the investor-ready format to confidently present your projections to banks, franchise representatives, or investors.