
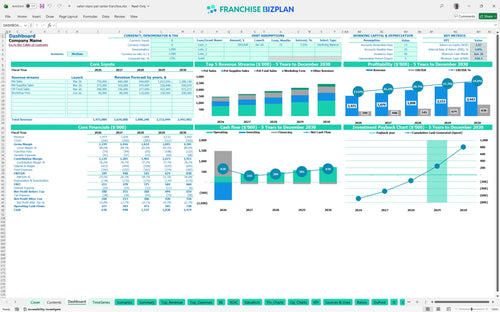
All-in-one Dashboard
Core inputs and core outputs


This tool provides a complete Excel template for franchise unit financial forecasting, including pre-filled pet retail data and dynamic dashboards for owner decision-making.
Core inputs and core outputs
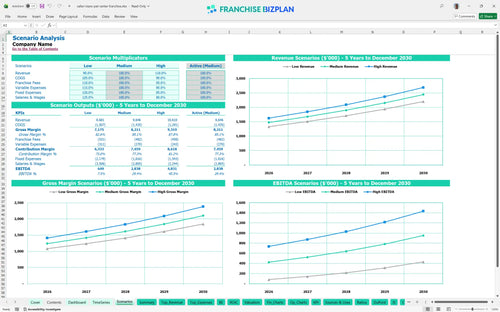
Three scenario analysis
Presentation ready
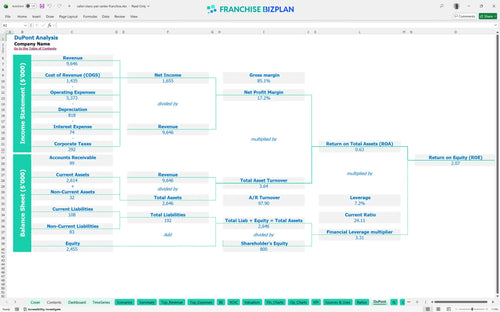
DuPont analysis
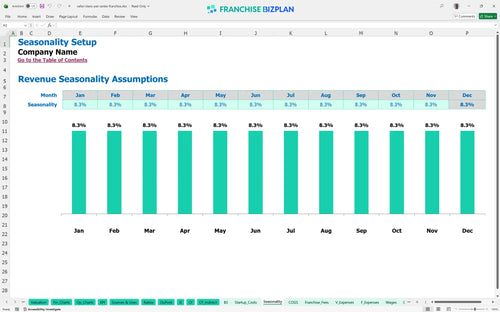
Researched revenue assumptions
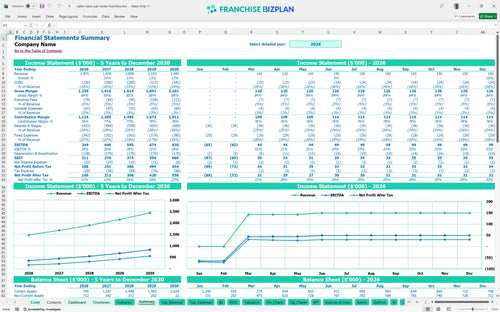
Lender-friendly financial outputs
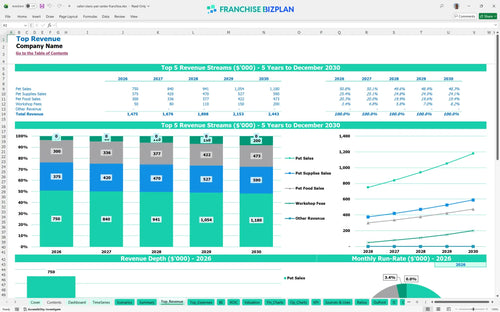
Revenue stream detailed view
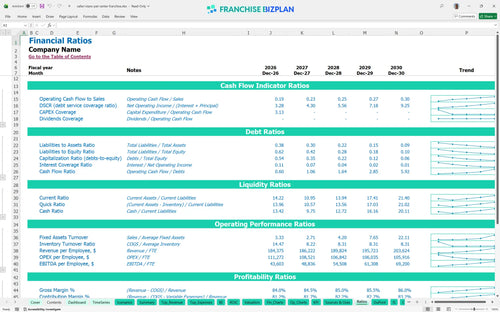
Performance metrics benchmark
We built this franchise unit financial model using our own research into high-end pet retail operations. Key assumptions like the $1.475M Year 1 revenue and the 4.5% royalty fee are pre-populated and fully editable to match your specific location. This tool helps you move from guessing to data-driven planning for your new store.
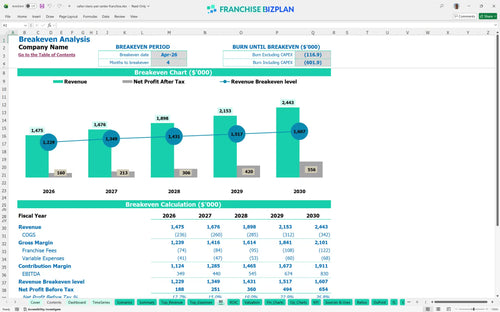
You can expect this unit to hit its stride quickly, reaching breakeven by April 2026, just four months after launching. With Year 1 EBITDA projected at $349,000 and scaling to $830,000 by Year 5, the model shows a clear path to high-margin operations once the initial ramp-up is complete.
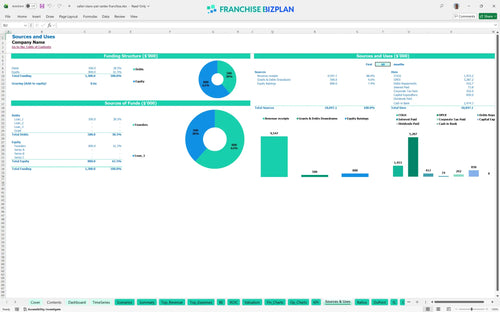
Launching this unit requires approximately $850,000 in startup capital, excluding your initial working capital buffer. The bulk of your funds will go toward leasehold improvements and specialized animal enclosures to meet brand standards for a high-end pet retail environment.
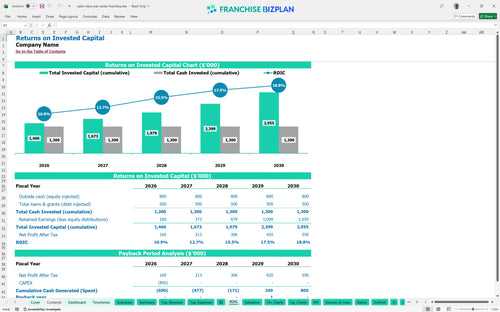
For a pet store franchise business plan financial template, the returns are steady, featuring a 4-year payback period and an IRR of 3.77%. While the initial cash outlay is significant, the ROE of 2.07 suggests a solid long-term play for operators focused on building equity in a premium territory.
Your monthly break-even depends heavily on managing the $20,000 monthly rent and the 5% total royalty burden. Since you reach breakeven in month 4, the focus must stay on high-ticket pet sales and consistent workshop fees to cover the fixed $31,500+ in monthly operating expenses.
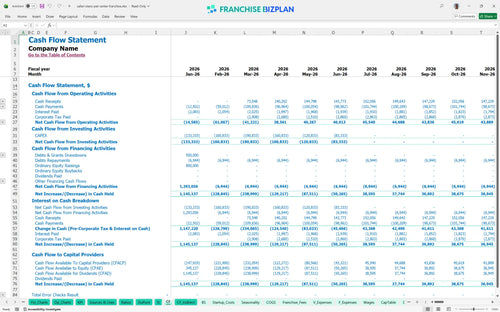
Your lowest cash point hits $410,000 in June 2026, so you defintely need a buffer to handle the ramp-up phase. This franchise investment analysis spreadsheet for small business shows that while you break even early, the initial build-out costs create a deep cash trough.
Analyzing unit-level economics for retail franchises requires looking at how a 10% drop in pet sales affects your Year 1 margin. In a low-revenue scenario, your peak cash need will rise significantly, while the high-growth case could shorten your payback period by several months if workshop fees exceed expectations.
This franchise unit financial model template is built in Excel, giving you total control over every variable from pet procurement costs to local labor rates. You can swap out our researched assumptions for your specific site data to see how different rent or staffing levels impact your bottom line.

Planning for a pet store franchise investment requires a long-term view of how revenue scales as you build a local reputation. This tool provides a clear 5-year outlook on your profit and loss statement, helping you see the transition from startup phase to a mature, high-volume retail operation.

Managing the ongoing costs of a retail franchise financial projections means accounting for every dollar sent back to the franchisor. The model automatically calculates the 4.5% royalty and 0.5% marketing fund contributions based on your monthly sales, so you always know your true store-level margin.

Knowing how to calculate startup costs for a retail pet franchise is the difference between a smooth launch and a cash crunch. This small business franchise calculator breaks down your $850,000 initial investment and identifies the exact sales volume needed to cover your fixed monthly overhead.

We have integrated retail franchise ROI benchmarks to help you verify if your projected 10.5% live animal procurement cost is realistic for the premium pet market. These built-in standards allow you to compare your unit economics dashboard against established industry norms to ensure your business plan holds water.


Simply purchase and download the financial model template, then access it instantly using Microsoft Excel or Google Sheets. No installation or technical expertise required-just open and start working.

Enter your business-specific numbers, including revenue projections, costs, and investment details. The pre-built formulas will automatically calculate financial insights, saving you time and effort.

Leverage the investor-ready format to confidently showcase your financial projections to banks, franchise representatives, or investors. Impress stakeholders with clear, data-driven insights and professional reports.

Leverage the investor-ready format to confidently present your projections to banks, franchise representatives, or investors.