
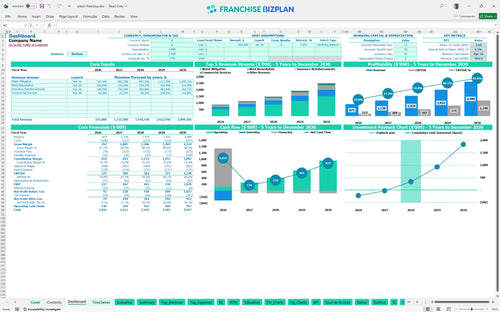
All-in-one Dashboard
Core inputs and core outputs


The Excel template for franchise financial projections includes dynamic revenue streams, a detailed CAPEX schedule for drying equipment, and a 5-year payroll plan for five distinct staff positions.
Core inputs and core outputs
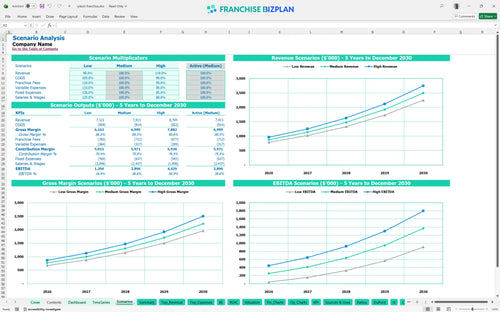
Three scenario analysis
Presentation ready
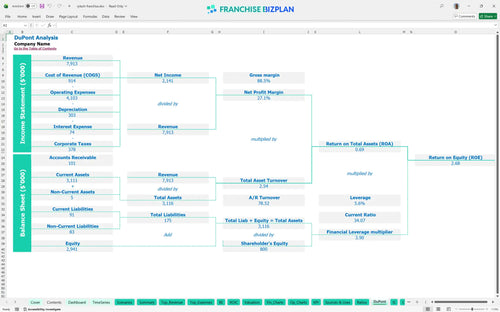
DuPont analysis
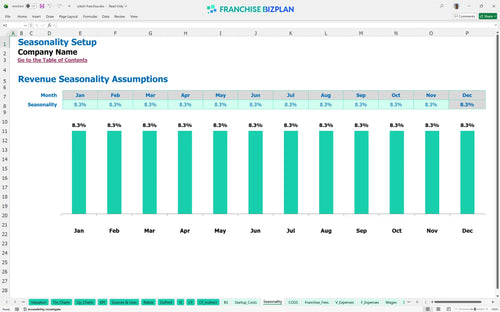
Researched revenue assumptions
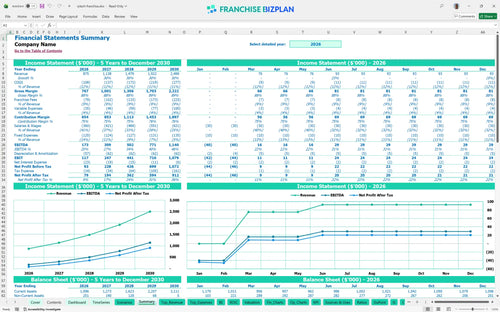
Lender-friendly financial outputs
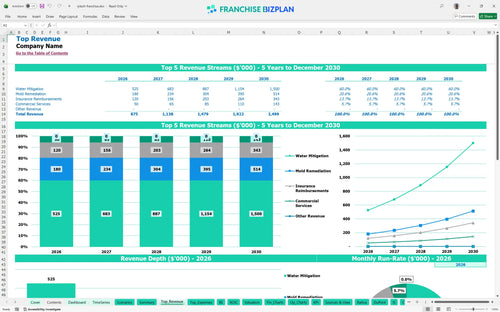
Revenue stream detailed view
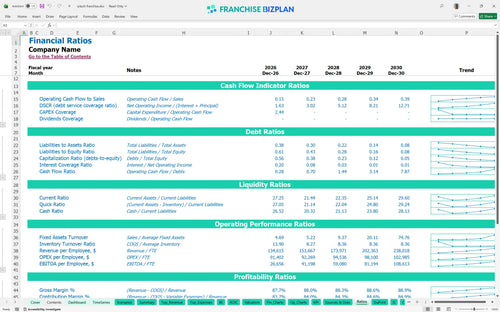
Performance metrics benchmark
We built this restoration franchise unit financial model using detailed research on emergency response operations and property mitigation. Key assumptions for water mitigation, mold remediation, and insurance reimbursements are pre-populated with data showing a year-one EBITDA of $173,000 and are fully editable to match your specific territory.
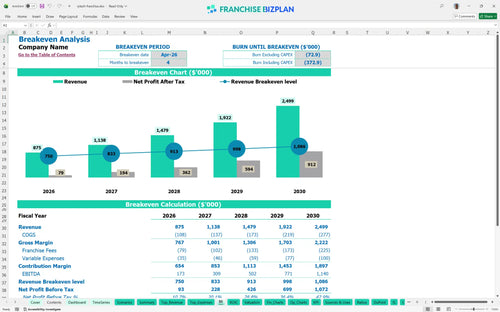
This franchise unit reaches profitability in April 2026, just four months after launching operations. Water damage restoration franchise profit margins are driven by scaling revenue from $875,000 in the first year to over $2.4 million by year five while maintaining tight control over consumables and fuel.
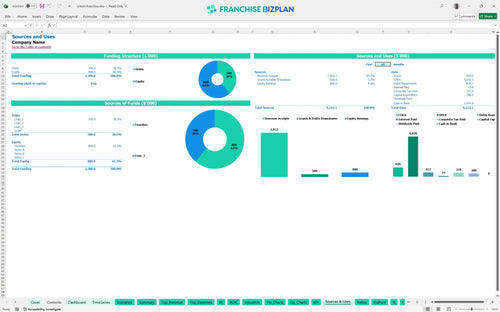
You need approximately $308,000 in initial capital for equipment and fees, but the financial model for emergency response business suggests a total cash requirement of $905,000 to cover the ramp-up. How to calculate franchise startup costs involves totaling the $60,000 franchise fee, $90,000 in vehicles, and $45,000 in drying equipment.
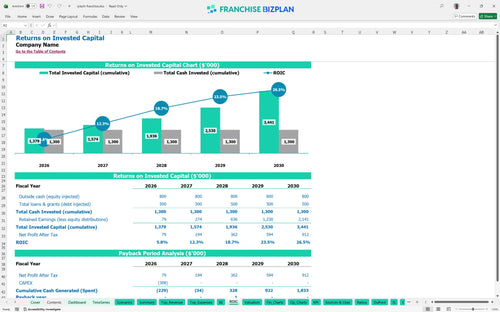
The franchise ROI calculation indicates an Internal Rate of Return (IRR) of 6.54% with a full payback period of 3 years. Projecting revenue for property mitigation services shows a Return on Equity (ROE) of 2.68, reflecting the steady cash flow generated once the referral network is established.
The monthly break-even point is reached in April 2026, requiring about four months of trading to cover the $4,800 monthly rent and $1,500 in utilities. The primary driver for reaching this point is the volume of water mitigation jobs, which carry a lower supply cost than other services.
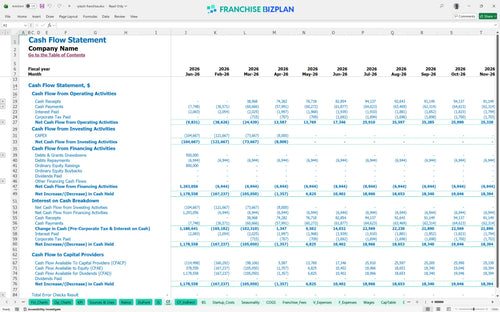
The lowest cash point occurs in April 2026 at $905,000, requiring a significant startup capital requirement for restoration franchise stability. You defintely need a cash buffer to handle the lag in insurance reimbursements, which only begin to scale significantly three months after the initial launch.
Franchise business financial forecasting Excel scenarios show that a High case can push year-one EBITDA well above $173,000 if commercial service agreements exceed the $50,000 baseline. Conversely, a Low case scenario highlights the risk if mold remediation demand falls below the $120,000 year-one forecast.
This franchise financial model template is built in Excel with pre-filled formulas and editable assumptions, allowing you to adapt it to any territory or market. You can quickly adjust the franchise business plan spreadsheet to reflect local labor rates, regional pricing, and specific site selection variables without rebuilding the logic from scratch.

Long-term planning is essential for this restoration franchise business model, which maps out a path from $875,000 in year-one revenue to $2,499,000 by year five. Financial forecasting for startups helps you visualize how scaling from 1.5 to 3.5 certified technicians impacts your store-level margin over a 60-month horizon.

Calculating royalty fees and franchise expenses is automated within the model to ensure you account for the 8% royalty and 1% marketing fund off the top. This focus on franchise unit economics ensures that multi-unit operators and first-time owners see the true net cash flow after all brand-level obligations are met.

The franchise startup cost calculator includes the $60,000 initial fee and $90,000 for service vehicles to provide a clear picture of your total entry cost. Analyzing break-even point for franchise unit performance shows that reaching the necessary sales volume to cover fixed costs like the $4,800 monthly warehouse rent is achievable within the first year.

This franchise profitability analysis tool incorporates researched benchmarks, such as mitigation supplies starting at 10.5% of revenue, to help you sanity-check your operating expense budget template. It allows you to compare your expected performance against typical industry ranges for fuel, insurance, and labor to identify potential margin leaks early.


Simply purchase and download the financial model template, then access it instantly using Microsoft Excel or Google Sheets. No installation or technical expertise required-just open and start working.

Enter your business-specific numbers, including revenue projections, costs, and investment details. The pre-built formulas will automatically calculate financial insights, saving you time and effort.

Leverage the investor-ready format to confidently showcase your financial projections to banks, franchise representatives, or investors. Impress stakeholders with clear, data-driven insights and professional reports.

Leverage the investor-ready format to confidently present your projections to banks, franchise representatives, or investors.