
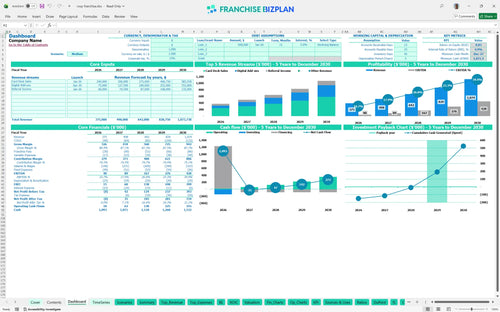
All-in-one Dashboard
Core inputs and core outputs


This Excel template for franchise unit financial forecasting provides a detailed roadmap for launching and scaling a luxury direct mail business with integrated digital retargeting capabilities.
Core inputs and core outputs
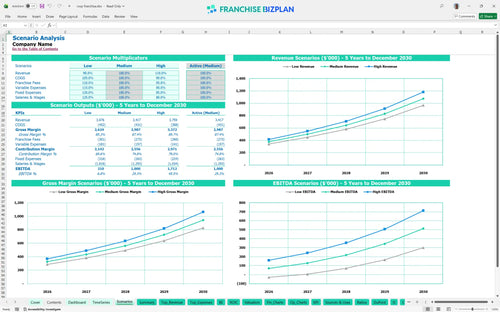
Three scenario analysis
Presentation ready
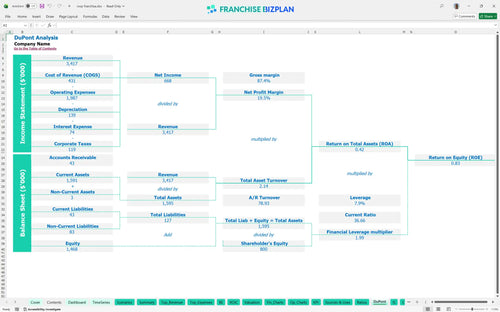
DuPont analysis
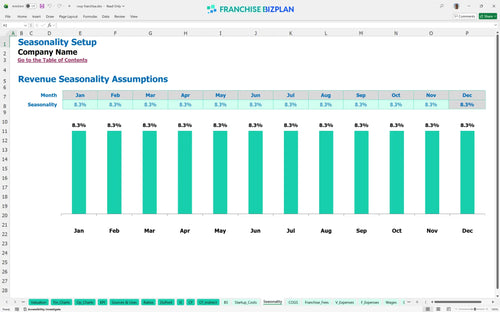
Researched revenue assumptions
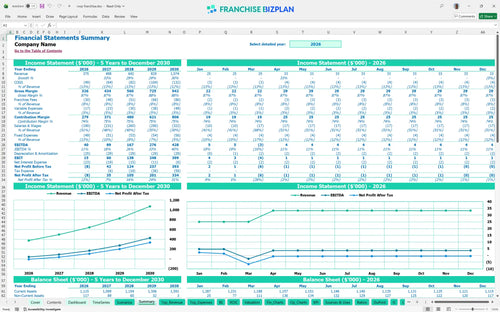
Lender-friendly financial outputs
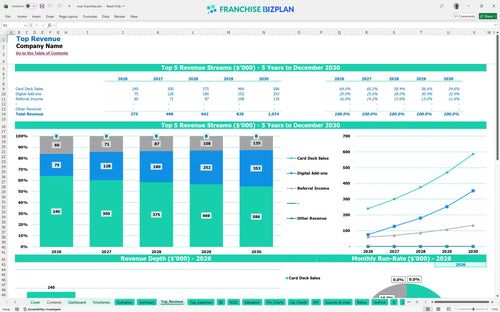
Revenue stream detailed view
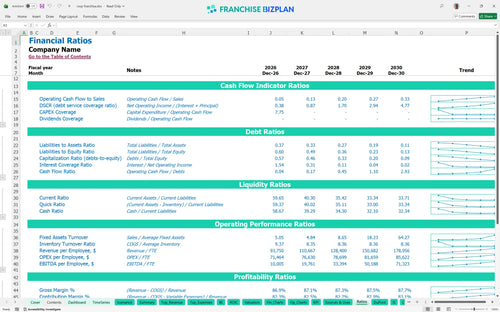
Performance metrics benchmark
We built this advertising franchise financial projections tool using research on luxury marketing models and specific unit data. Key assumptions like the $375,000 year-one revenue and 7% royalty fees are pre-populated but fully editable to help you evaluate franchise investment opportunities for entrepreneurs in your local area.
This unit shows immediate operational viability, hitting an EBITDA of $40,000 in its first year. By year three, as digital add-ons scale to $120,000, net profit accelerates because fixed costs like the $2,500 monthly rent remain stable while revenue grows toward the $1.07M year-five target.
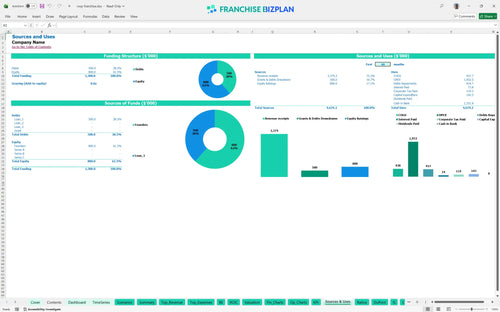
You need approximately $142,500 to launch this unit in the US, covering everything from the $15,000 franchise fee to the $45,000 in leasehold improvements. This capital allocation ensures you have the infrastructure, company vehicle, and CRM systems ready for a January launch.
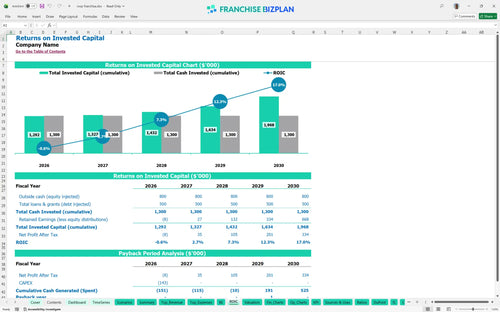
The model projects a 4.87% IRR and a 4-year payback period on the initial startup costs for a local advertising franchise unit. While the early returns are steady, the ROE of 0.83 indicates that the business builds significant equity value as EBITDA grows to $428,000 by year five.
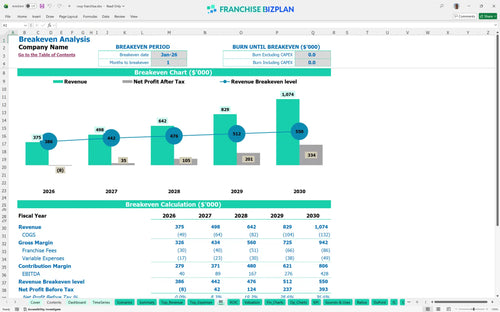
Break-even is achieved in January 2026, just one month after launch, provided you hit the initial sales targets. The primary driver here is sales volume; since rent and insurance are fixed at roughly $4,650 monthly, every extra ad sold drops straight to the bottom line after royalties.
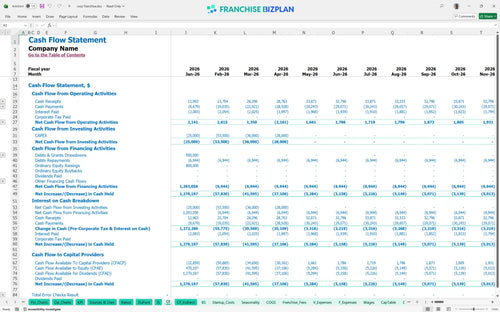
The lowest cash point occurs in December 2027 at $1,071,000, suggesting the business generates strong cash flow after the initial setup. Still, you should maintain a cash flow projection template for franchise operations to handle the timing gap between printing invoices and advertiser payments.
Shifting to a high-growth scenario by increasing card deck sales by 20% dramatically improves the year-1 EBITDA. Conversely, a low-growth case where digital add-ons fail to gain traction would extend the 4-year payback period and tighten the $1,071 minimum cash position during the ramp-up phase.
Finance: update unit break-even and payback model by Friday
This franchise financial model template is a flexible Excel tool designed for the advertising space. You can swap out the pre-filled assumptions for your specific territory, adjusting everything from card deck production volume to local sales commissions to ensure the numbers match your specific market reality.

Planning a marketing agency franchise requires looking past the first mailing. This model tracks your trajectory from a $375,000 year-one start to a projected $1,074,000 by year five, ensuring you see how scaling sales staff impacts your bottom line as the business matures.

Royalties and brand funds are the ongoing costs of using a proven system. With a 7% royalty and 1% marketing fee, you need to account for $30,000 in fees on $375,000 of revenue before you even pay for the stamps, making precise tracking essential for profitability analysis.

Use this franchise startup cost calculator to map out the $142,500 needed to get the doors open. From the $15,000 franchise fee to the $28,000 company vehicle, knowing your fixed costs helps you find the exact revenue level required to cover your monthly overhead.

We've baked in franchise unit economics that reflect a high-end service model. If your printing costs stay around 8% and mailing at 4.9%, you are hitting the marks, but if labor exceeds the planned $176,000 year-one payroll, your store-level margin will defintely shrink.


Simply purchase and download the financial model template, then access it instantly using Microsoft Excel or Google Sheets. No installation or technical expertise required-just open and start working.

Enter your business-specific numbers, including revenue projections, costs, and investment details. The pre-built formulas will automatically calculate financial insights, saving you time and effort.

Leverage the investor-ready format to confidently showcase your financial projections to banks, franchise representatives, or investors. Impress stakeholders with clear, data-driven insights and professional reports.

Leverage the investor-ready format to confidently present your projections to banks, franchise representatives, or investors.