
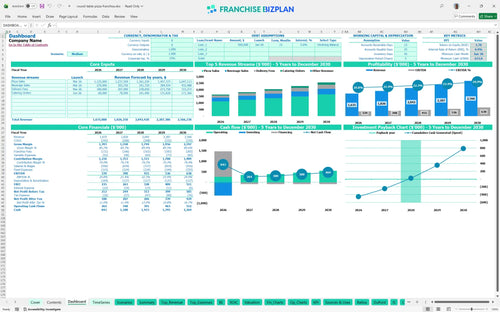
All-in-one Dashboard
Core inputs and core outputs


This comprehensive toolkit provides a dynamic Excel-based framework to evaluate the full lifecycle of a pizza franchise unit from initial build-out to five-year maturity.
Core inputs and core outputs
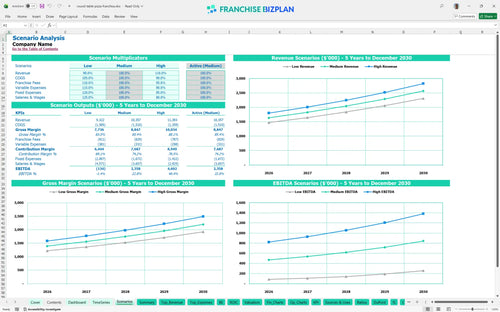
Three scenario analysis
Presentation ready
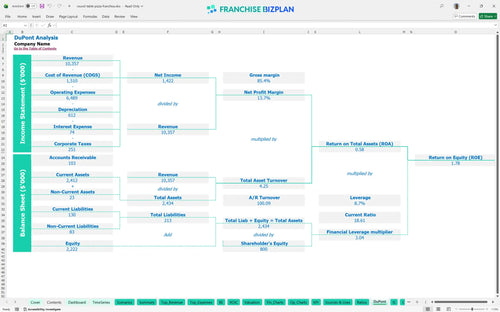
DuPont analysis
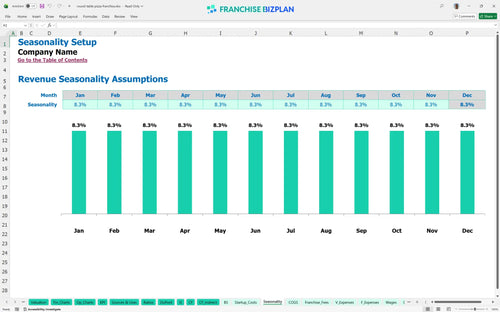
Researched revenue assumptions
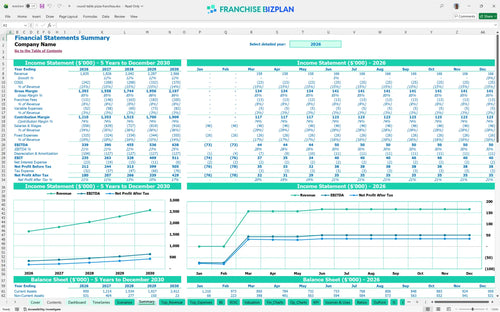
Lender-friendly financial outputs
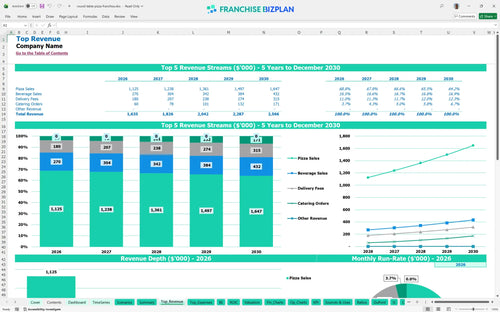
Revenue stream detailed view
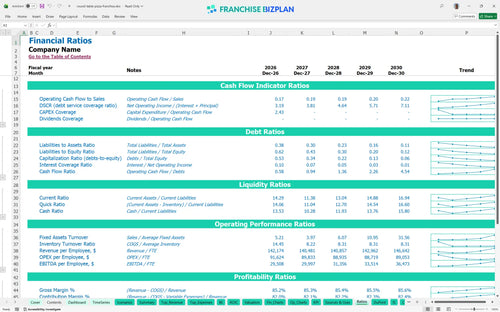
Performance metrics benchmark
We built this pizza franchise financial model using our own research to ensure your projections are grounded in reality. Key assumptions like the $1,635,000 year-one revenue and 4% royalty fees are pre-populated with researched data specific to this pizza concept and are fully editable. This tool helps you understand how to calculate pizza franchise startup costs without the guesswork.
The pizza franchise business financial feasibility study indicates the unit is profitable in its first full year of operation. With EBITDA starting at $339,000 and growing to $638,000 by year five, the unit economics support a healthy long-term outlook. Profit is a habit, not an accident.
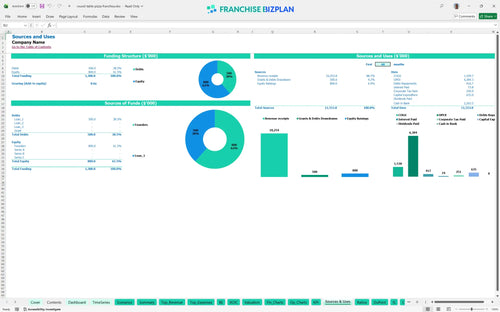
Launching this unit in the US requires $635,000 in total capital for the initial startup cost breakdown for quick service restaurant operations. This covers the $25,000 franchise fee, $250,000 in leasehold improvements, and $120,000 for high-end kitchen equipment. Capital is the fuel for your pizza oven.
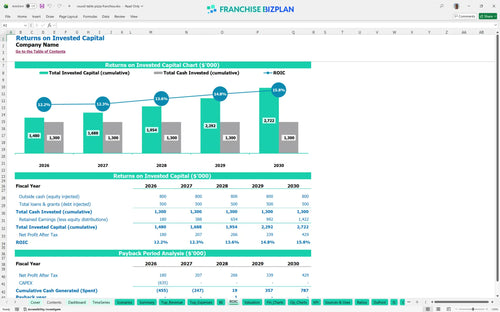
Calculating return on investment for pizza franchise operations shows an IRR of 4.39% and a 3-year payback period. This pizza franchise unit profitability analysis excel model also tracks a 1.78 return on equity, providing a clear pizza restaurant P&L template for your partners. Cash back in three years is a solid win.
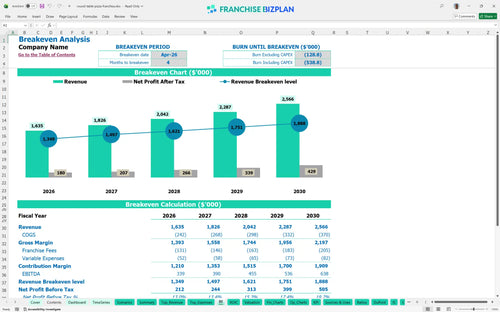
The monthly break-even point is reached in April 2026, just four months after the doors open. This rapid timeline is driven by the $1.63M annual revenue volume and requires a disciplined approach to the 4% royalty and 4% marketing fund obligations. Speed to break-even is the best risk mitigator.
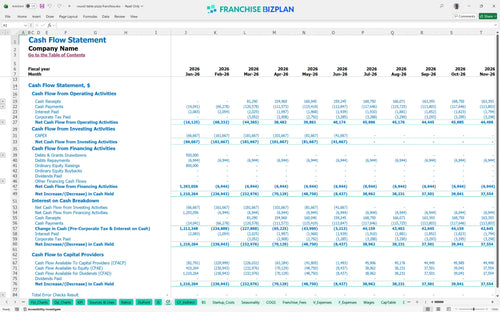
Your lowest cash point hits $613,000 in June 2026, making diligent cash flow forecasting essential during the first six months. This financial planning guide for new franchise owners suggests keeping a tight grip on the $18,000 monthly rent and $85,000 manager salary to maintain liquidity. You defintely need to watch the burn rate. Cash is more important than your ego.
The franchise unit financial projection includes sensitivity analysis to show how a 10% shift in food costs or labor impacts your 4.39% IRR. Adjusting your franchise capital expenditure for the $70,000 delivery fleet can significantly alter your peak cash needs in the low-growth case. Plan for the worst so you can enjoy the best.
Finance: update unit break-even and payback model by Friday
This pizza franchise financial model is built in Excel so you can tweak every variable as your local market dictates. It features pre-filled formulas and editable assumptions that allow you to swap out costs or adjust pricing on the fly. Flexibility is the key to a model that actually works.

Our franchise business plan template provides a clear 5-year outlook on your P&L, cash flow, and balance sheet. It helps you map out the transition from a single-unit startup to a mature, cash-flowing asset. Five years is the standard horizon for a serious operator.

This financial model template for new restaurant franchise units handles the 4% royalty and 4% marketing fees automatically. It captures the initial $25,000 fee and ongoing obligations so you see the true net margin after the franchisor takes their cut. Royalties are a top-line hit you can't ignore.

The restaurant franchise operational budget template breaks down your $635,000 initial spend and calculates exactly when you stop burning cash. It maps out your build-out, equipment, and working capital needs to ensure you aren't surprised by hidden costs. Knowing your break-even keeps the lights on.

By estimating labor and food costs for pizza franchise units against industry standards, you can spot margin leaks before they sink you. The model includes benchmarks for occupancy and gross margins to help you sanity-check your projections. Benchmarks tell you if your manager is sleeping on the job.


Simply purchase and download the financial model template, then access it instantly using Microsoft Excel or Google Sheets. No installation or technical expertise required-just open and start working.

Enter your business-specific numbers, including revenue projections, costs, and investment details. The pre-built formulas will automatically calculate financial insights, saving you time and effort.

Leverage the investor-ready format to confidently showcase your financial projections to banks, franchise representatives, or investors. Impress stakeholders with clear, data-driven insights and professional reports.

Leverage the investor-ready format to confidently present your projections to banks, franchise representatives, or investors.