
All-in-one Dashboard
Core inputs and core outputs


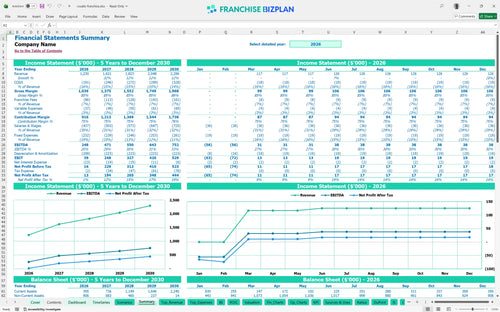
This tool provides a complete restaurant P&L statement with integrated cash flow and balance sheet tracking for a single pizza unit.
Core inputs and core outputs
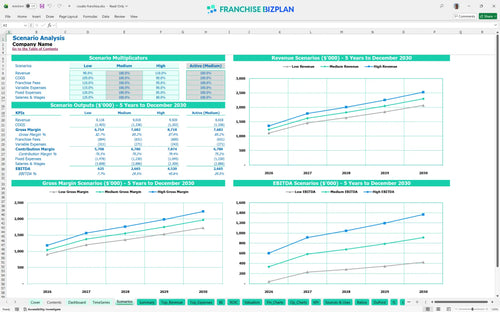
Three scenario analysis
Presentation ready
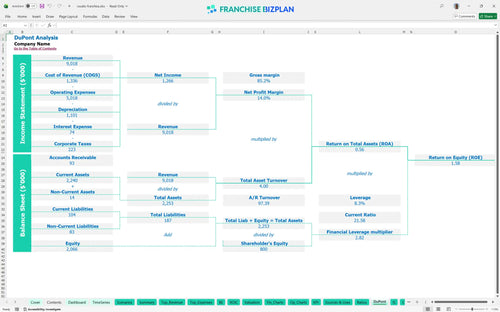
DuPont analysis
Researched revenue assumptions
Lender-friendly financial outputs
Revenue stream detailed view
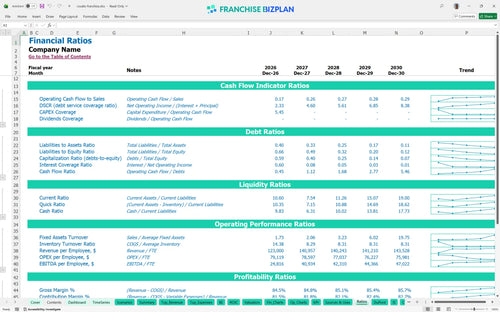
Performance metrics benchmark
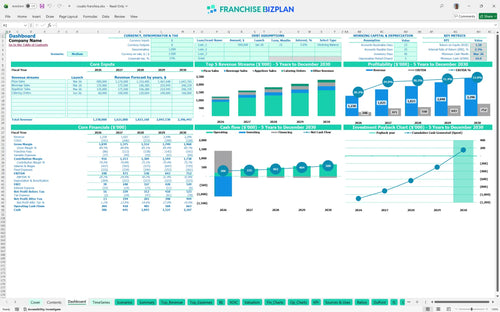
We built this franchise unit financial model using our own research to help you plan your investment with precision. Key assumptions, including the $1.23M year-one revenue and $248,000 EBITDA, are pre-populated with researched data and are fully editable to fit your specific market and territory.
The unit becomes profitable in its first year, generating a $248,000 EBITDA as it ramps up pizza and catering sales. Evaluating pizza franchise profitability requires monitoring the unit economics as food ingredients costs drop from 13.5% to 12.3% over the five-year forecast period.
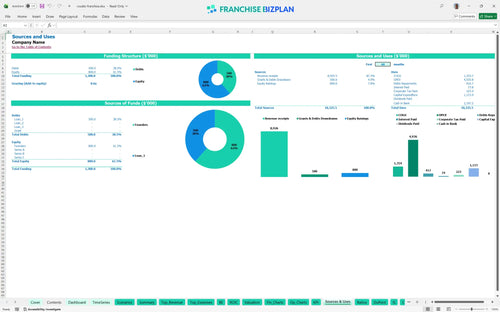
Launching this unit requires a total initial investment of $1,115,000, which includes the $35,000 franchise fee and $500,000 in leasehold improvements. Learning how to calculate franchise startup costs in Excel is vital for capital expenditure forecasting, especially when balancing the $300,000 kitchen equipment outlay with opening cash needs.
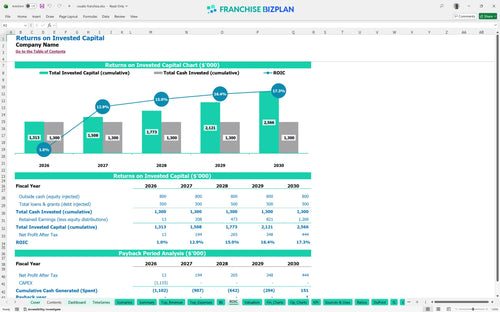
Investors can expect a 5-year payback period with an Internal Rate of Return (IRR) of 2.34% and a Return on Equity (ROE) of 1.58. This restaurant franchise ROI calculator template shows that by year five, annual EBITDA reaches $752,000, significantly enhancing the potential exit valuation of the business.
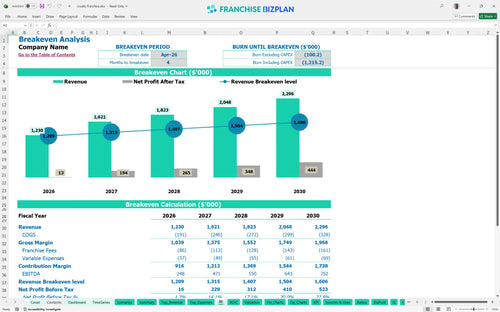
The unit reaches its monthly break-even point in April 2026, just four months after the initial launch. This franchise operational cost spreadsheet shows that calculating break-even point for food franchise success depends on maintaining roughly $102,500 in monthly revenue to cover the $12,000 rent and fixed management salaries.
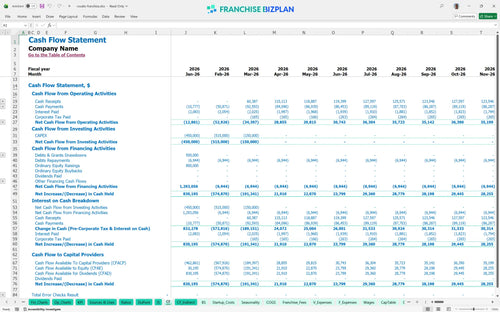
The lowest cash point occurs in March 2026 with a minimum balance of $64,000 during the initial ramp-up. This franchise financial planning spreadsheet for owners highlights that the first 90 days are defintely the most critical, requiring a disciplined approach to working capital and inventory management.
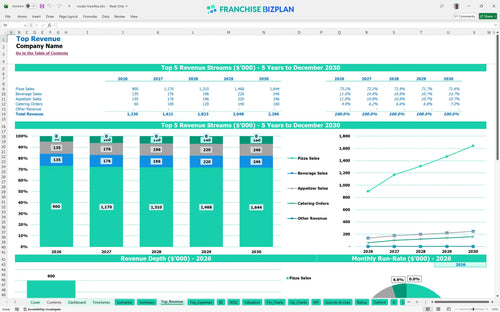
Estimating monthly revenue for pizza delivery business involves testing how a 10% swing in traffic affects your 20.1% year-one EBITDA margin. Forecasting catering revenue for pizza franchise is a major lever, as the $160,000 projected in year five provides a high-margin buffer against rising labor costs.
This franchise financial model template is built in Excel with fully editable assumptions, allowing you to adjust everything from pizza prep times to local labor rates. The franchise Excel model uses pre-filled formulas that automatically update your financial statements when you change key drivers like average ticket size or delivery radius.

Plan your long-term growth with detailed financial projections for pizza restaurant franchise units, mapping out a path from the $1.23M year-one revenue to $2.29M by year five. This pizza franchise business plan tool tracks how scaling catering and dine-in traffic impacts your bottom line over a sixty-month horizon.

The model accurately calculates your ongoing franchise royalty fees at 5% and marketing fund contributions at 2%, ensuring you see the true net cash flow after brand obligations. It accounts for the initial $35,000 franchise fee and tracks how these recurring costs scale as your pizza sales grow over time.

Use the franchise startup cost calculator to estimate your total initial investment, including the $500,000 leasehold improvement and $300,000 kitchen equipment costs. This section helps you identify the exact monthly sales volume needed to cover your fixed operating expenses and variable food costs.

This restaurant franchise profitability analysis incorporates industry-standard benchmarks for food costs, which start at 13.5% in this model, and labor productivity. You can compare your projected occupancy and payroll expenses against typical pizza industry averages to ensure your store-level margins remain competitive.


Simply purchase and download the financial model template, then access it instantly using Microsoft Excel or Google Sheets. No installation or technical expertise required-just open and start working.

Enter your business-specific numbers, including revenue projections, costs, and investment details. The pre-built formulas will automatically calculate financial insights, saving you time and effort.

Leverage the investor-ready format to confidently showcase your financial projections to banks, franchise representatives, or investors. Impress stakeholders with clear, data-driven insights and professional reports.

Leverage the investor-ready format to confidently present your projections to banks, franchise representatives, or investors.