
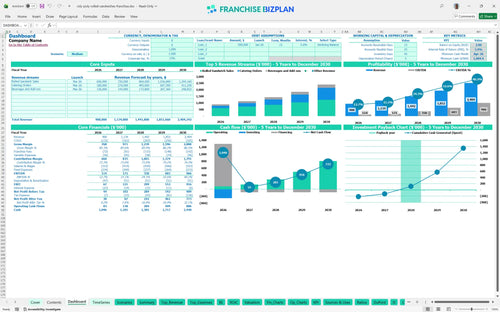
All-in-one Dashboard
Core inputs and core outputs


This Excel financial template for quick-service restaurant startup provides a complete toolkit for forecasting revenue, managing expenses, and calculating total investment returns.
Core inputs and core outputs
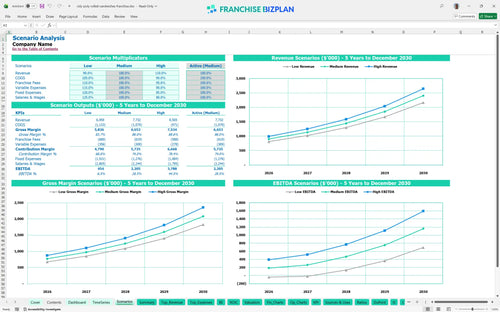
Three scenario analysis
Presentation ready
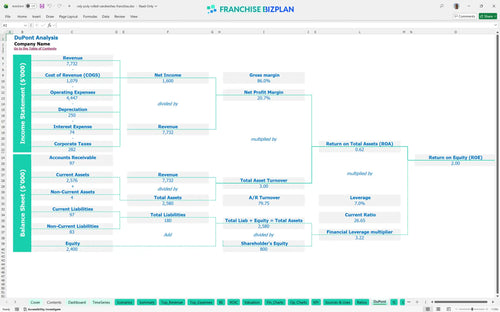
DuPont analysis
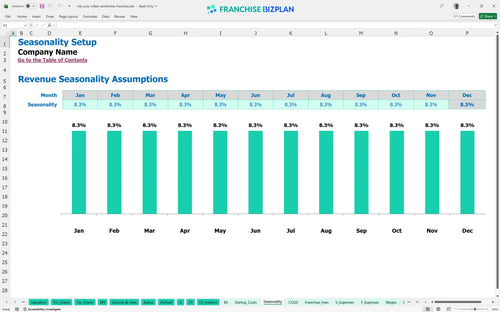
Researched revenue assumptions
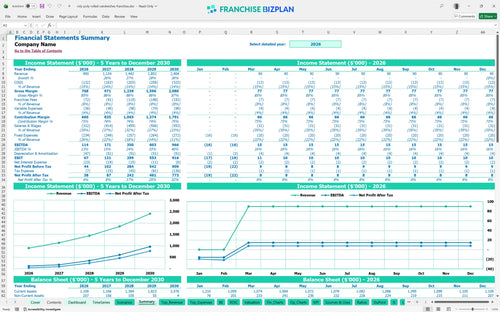
Lender-friendly financial outputs
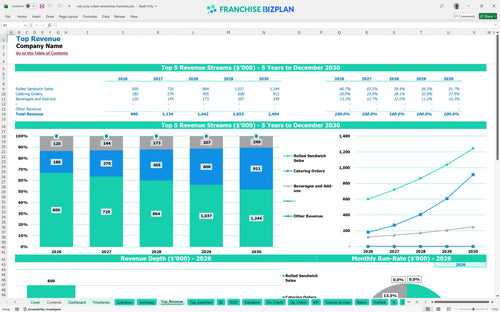
Revenue stream detailed view
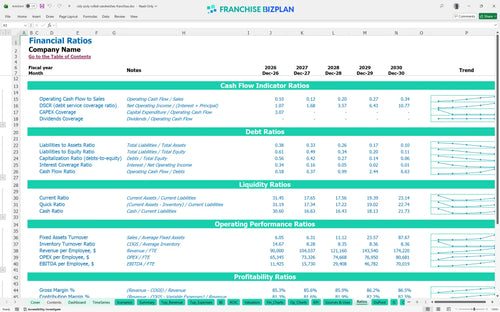
Performance metrics benchmark
We developed this model based on deep market research into the rolled sandwich sector and fast-casual trends. The tool comes pre-loaded with data like a $22,500 franchise fee and detailed unit economics for restaurants, showing an initial EBITDA of $114,000 that scales as catering orders grow.
The unit reaches profitability in its first year, with EBITDA jumping from $114,000 to $966,000 by year five. This growth is driven by a steady decline in food ingredient costs from 12.8% to 11.6% as you optimize your supply chain. Margin expansion comes from efficiency.
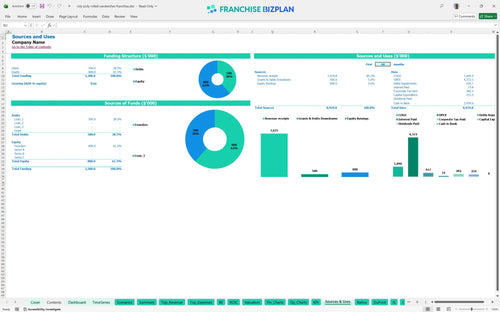
You need approximately $253,500 to get the doors open, covering everything from the $22,500 franchise fee to $110,000 in leasehold improvements. This franchise capital expenditure planning ensures you have enough for the $45,000 in prep equipment and $28,000 for refrigeration. Allocation matters as much as the total amount.
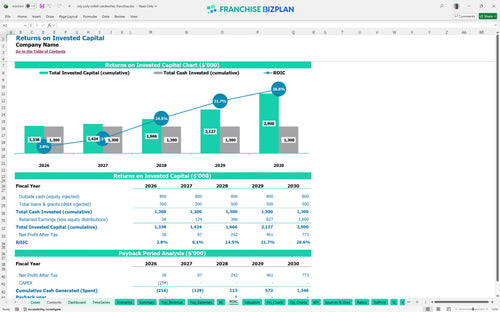
This franchise investment ROI analysis template shows a 3-year payback period and an Internal Rate of Return (IRR) of 5.86%. While the IRR seems conservative, the Return on Equity (ROE) of 2 indicates a solid doubling of your initial position over five years. Cash flow is king, but ROI is the goal.
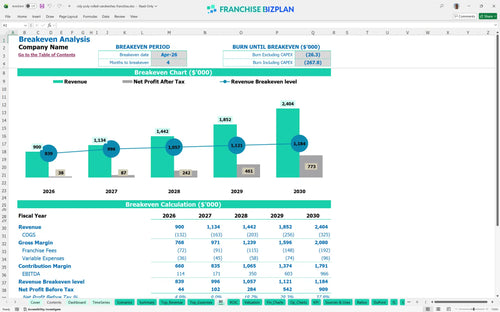
The model shows you hit break-even in April 2026, just four months after launching the restaurant franchise business plan. To maintain this, you must manage the $14,000 monthly rent and keep the 8% combined royalty and marketing fee from eating your margin. Speed to break-even reduces your personal risk.
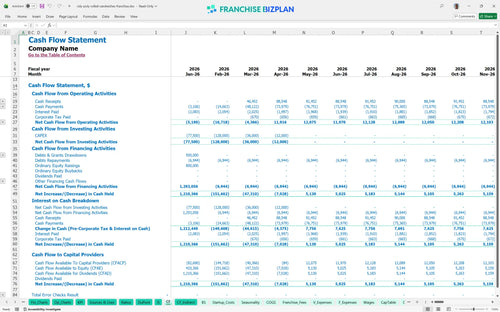
Your lowest cash point occurs in April 2026, coinciding with the break-even month, with a minimum cash balance of $1,004,000 including initial funding. This suggests a defintely strong liquidity position, but you should still monitor the $14,000 rent and $58,000 manager salary closely. Liquidity is your best defense against slow months.
When preparing financial projections for a new franchise location, testing scenarios is critical for best practices for franchise unit financial forecasting. A high-growth scenario focusing on estimating labor and food costs for catering businesses could push year-one revenue past $900,000. Plan for the worst, but build for the best.
Finance: update unit break-even and payback model by Friday
This franchise financial model template is built in Excel, allowing you to tweak every variable from sandwich prices to local labor rates. You can adjust the pre-filled formulas to reflect your specific territory's rent or catering demand, making it a versatile financial model template for new restaurant franchisees. Every cell is open for your input.

Planning for sandwich shop franchise projections requires a long-term view of how catering and walk-in traffic scale over time. This model provides a full 5-year outlook, showing revenue growing from $900,000 in year one to over $2.4 million by year five, helping with financial planning for small business franchise expansion. Growth depends on scaling the catering side.

Understanding the impact of the 6% royalty and 2% marketing fee is vital for a franchise unit profitability analysis. The model automatically calculates these off gross sales, ensuring you see the exact dollar amount leaving the business before you pay your own bills. Royalties are a top-line tax you must plan for.

Use the franchise startup cost calculator to map out the $253,500 initial investment, including leasehold improvements and equipment. This tool helps you how to calculate startup costs for a sandwich franchise and identifies the exact sales volume needed to cover your $14,000 monthly rent. Know your numbers before signing the lease.

We include benchmarks for operating expenses for fast-casual dining, such as food costs starting at 12.8% and labor scaling with your staff count. This allows for evaluating profitability of a lunch-focused franchise against real-world standards to ensure your margins stay healthy. Don't fly blind without industry standards.


Simply purchase and download the financial model template, then access it instantly using Microsoft Excel or Google Sheets. No installation or technical expertise required-just open and start working.

Enter your business-specific numbers, including revenue projections, costs, and investment details. The pre-built formulas will automatically calculate financial insights, saving you time and effort.

Leverage the investor-ready format to confidently showcase your financial projections to banks, franchise representatives, or investors. Impress stakeholders with clear, data-driven insights and professional reports.

Leverage the investor-ready format to confidently present your projections to banks, franchise representatives, or investors.