
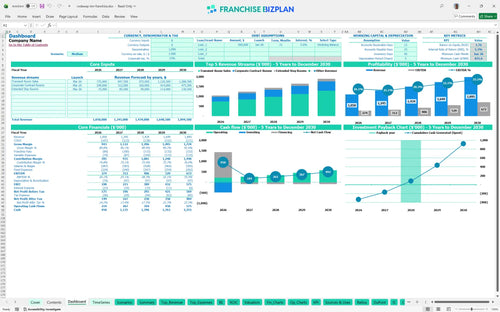
All-in-one Dashboard
Core inputs and core outputs


This financial model provides a data-driven roadmap for operating an economy hotel franchise, covering everything from initial fit-out costs to five-year cash flow projections.
Core inputs and core outputs
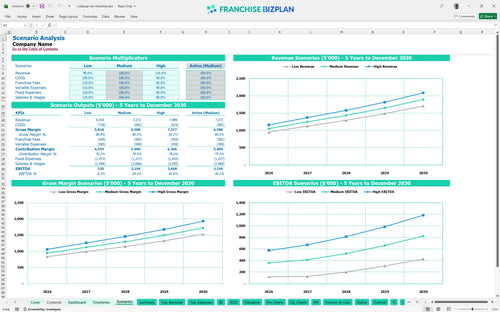
Three scenario analysis
Presentation ready
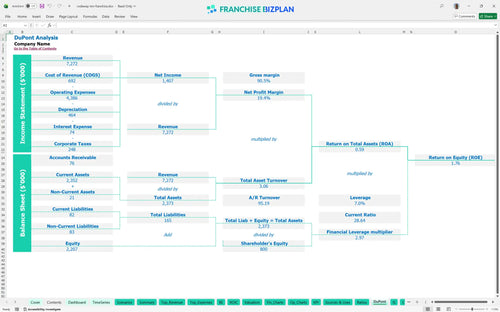
DuPont analysis
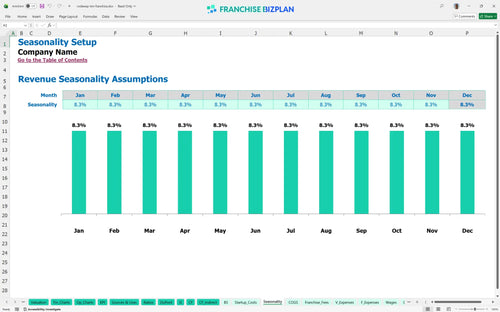
Researched revenue assumptions
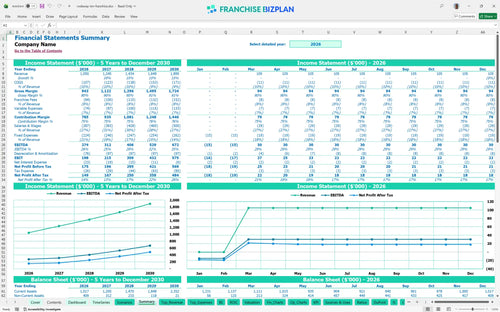
Lender-friendly financial outputs
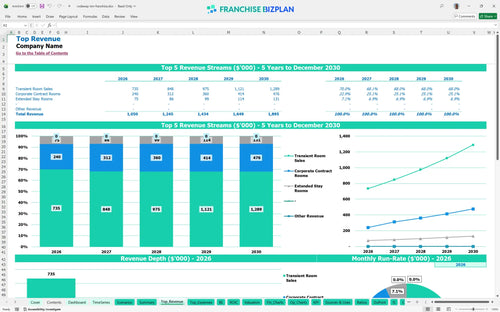
Revenue stream detailed view
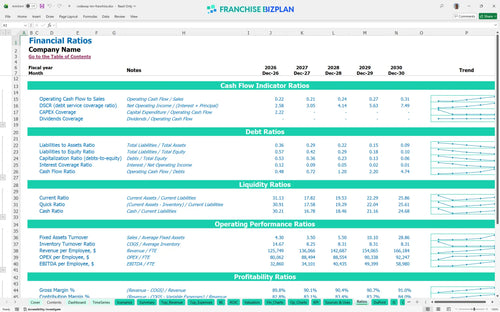
Performance metrics benchmark
We built this franchise unit financial model using deep research into the economy lodging sector to ensure your projections are grounded in reality. Key assumptions, including the $15,000 franchise fee, 5% royalty, and revenue streams from transient and corporate guests, are pre-populated and fully editable. With Year 1 revenue projected at $1,050,000 and EBITDA at $274,000, this tool gives you the precision needed to evaluate the true potential of your investment.
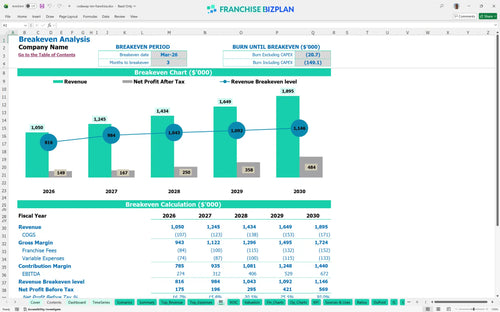
The franchise unit reaches profitability almost immediately, with a projected break-even date in March 2026, just three months after the initial setup phase. By Year 1, the model shows an EBITDA of $274,000, which grows to $672,000 by Year 5 as revenue scales and housekeeping costs drop from 7.2% to 6.4%.
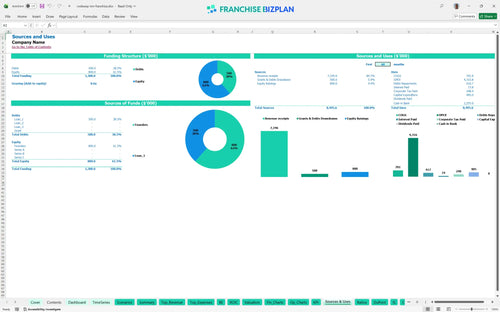
To launch this unit, you will need approximately $836,000 in total capital, which covers the $485,000 in initial CAPEX and provides a necessary cash buffer. The primary spend goes toward leasehold improvements and furniture, plus the $15,000 initial franchise fee required to secure the territory.
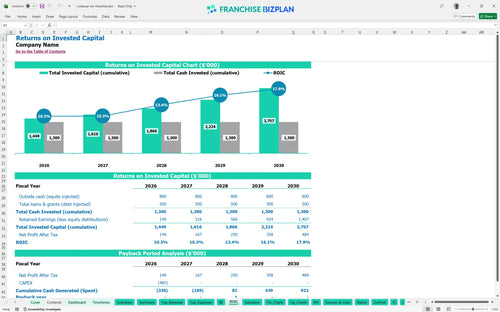
Investors can expect a payback period of 3 years, which is quite efficient for a physical hospitality asset. The model projects an Internal Rate of Return (IRR) of 5.3% and a Return on Equity (ROE) of 1.76, assuming you hit the Year 1 revenue target of $1,050,000.
The unit hits its monthly break-even point in March 2026, requiring enough room nights to cover the $12,000 monthly rent and $11,000 in base utilities and insurance. The biggest lever for reaching this point faster is your occupancy rate, specifically during mid-week periods when transient traffic is lower.
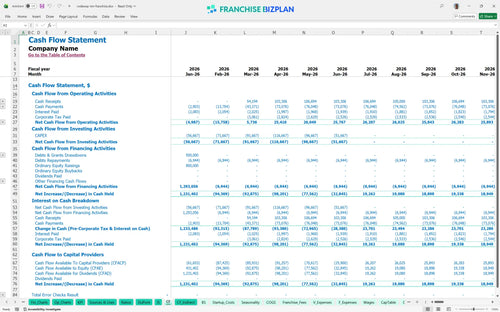
The lowest cash point occurs in June 2026, with a minimum cash balance of $836,000 after the bulk of the fit-out and initial marketing spend is complete. You have a solid runway, but you should maintain a buffer to handle the timing gaps between corporate contract billing and payroll cycles.
In the High scenario, pushing revenue toward the $1.89M Year 5 mark significantly expands the EBITDA margin as fixed costs like rent stay flat. A Low scenario would delay the 3-year payback and increase the peak cash need, so focus on maintaining the $55+ average ticket and consistent weekly traffic.
Finance: update unit break-even and payback model by Friday.
This franchise unit financial model is built entirely in Excel with open formulas and editable assumptions, making it simple to adjust for your specific territory and local market conditions. You can swap out the pre-filled data to test different rent prices, labor rates, or occupancy levels to see how they impact your bottom line before you sign a lease.

Plan your multi-year growth with detailed projections that track revenue, costs, and cash flow from your first guest through year five of operations. This model provides a clear view of how your economy hotel unit scales as you move from the initial ramp-up phase to a mature, stabilized property with optimized margins.

The model specifically tracks your financial obligations to the franchisor, including the initial $15,000 franchise fee and ongoing royalty and marketing contributions. By automating these calculations as a percentage of your gross room sales, you can defintely see the exact impact of brand overhead on your monthly store-level EBITDA.

Estimate your total initial investment by mapping out everything from leasehold improvements to your initial furniture and IT infrastructure. The model calculates your monthly break-even point, showing you the exact revenue needed to cover fixed costs like your $12,000 monthly lease and variable expenses like OTA commissions.

Use our integrated hospitality benchmarks to sanity-check your operating assumptions against industry standards for economy lodging. Compare your housekeeping supply costs, which start at 7.2% of sales, and your labor model against typical franchise performance to ensure your unit is running at peak efficiency.


Simply purchase and download the financial model template, then access it instantly using Microsoft Excel or Google Sheets. No installation or technical expertise required-just open and start working.

Enter your business-specific numbers, including revenue projections, costs, and investment details. The pre-built formulas will automatically calculate financial insights, saving you time and effort.

Leverage the investor-ready format to confidently showcase your financial projections to banks, franchise representatives, or investors. Impress stakeholders with clear, data-driven insights and professional reports.

Leverage the investor-ready format to confidently present your projections to banks, franchise representatives, or investors.