
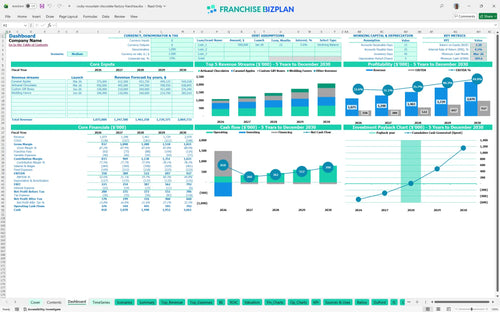
All-in-one Dashboard
Core inputs and core outputs


The model contains a complete set of interconnected financial statements and assumption tabs specifically tuned for a high-volume confectionery retail operation.
Core inputs and core outputs
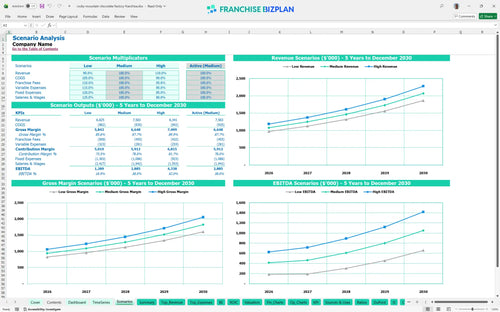
Three scenario analysis
Presentation ready
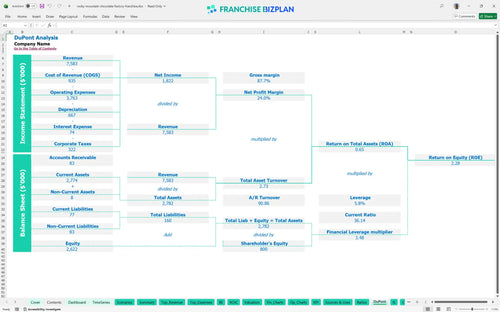
DuPont analysis
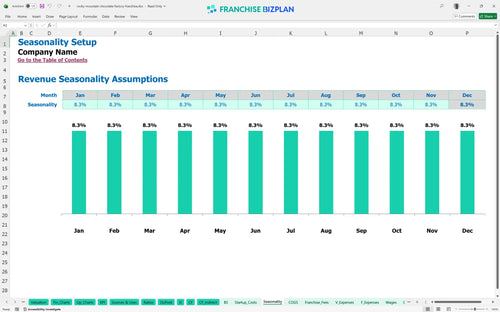
Researched revenue assumptions
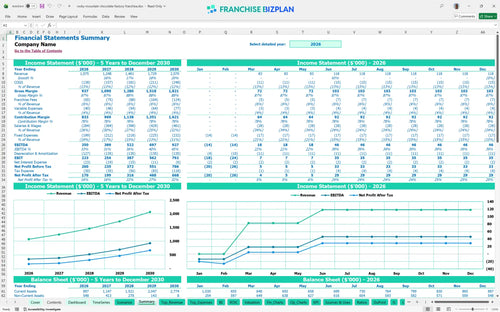
Lender-friendly financial outputs
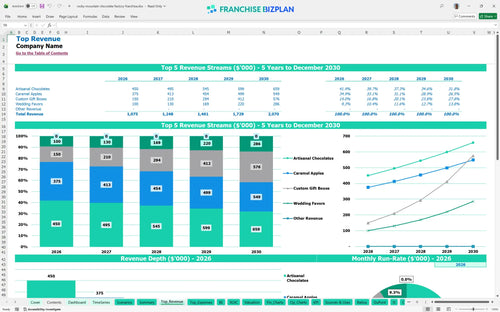
Revenue stream detailed view
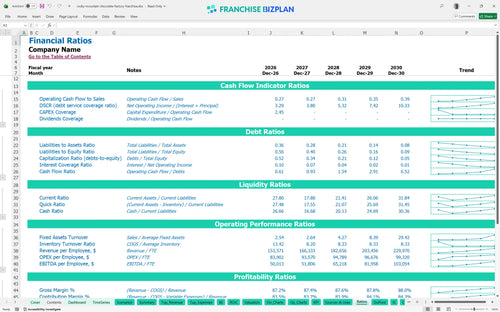
Performance metrics benchmark
We built this franchise unit financial model using deep research into high-traffic confectionery retail economics. Key assumptions for artisanal chocolate sales, $12,000 monthly rent, and a 6% combined fee structure are pre-populated and fully editable. This model shows a year one EBITDA of $350,000, giving you a data-driven starting point for your investment analysis.
The unit is projected to be profitable in its first year, generating $350,000 in EBITDA on $1,075,000 in revenue. This retail franchise profit analysis shows that even with a 5% royalty, the high margin on items like caramel apples and artisanal chocolates defintely drives early bottom-line success. Estimating profitability for a confectionery store franchise requires balancing these high margins against the $12,000 monthly rent for prime waterfront locations.
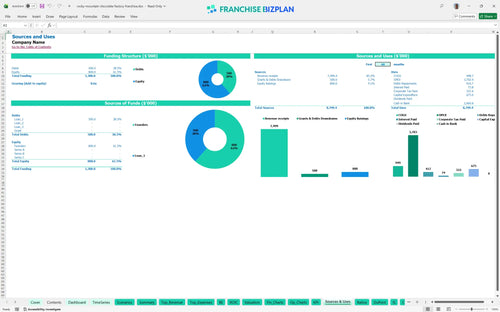
You will need approximately $675,000 in total capital to cover the initial franchise investment and store build-out. This budget includes the $35,000 franchise fee and $350,000 for leasehold improvements to create the required theatrical storefront. Knowing how to build a budget for a new franchise location is vital, as equipment like melters and dippers adds another $100,000 to the upfront cash requirement.
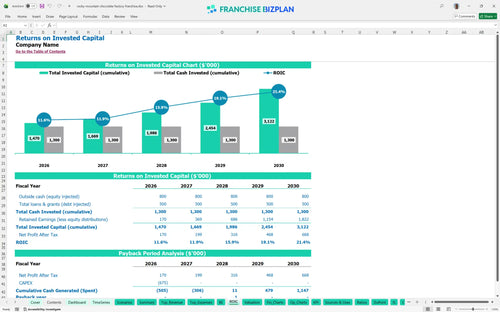
Investors can expect a 4.47% Internal Rate of Return (IRR) and a 2.28 Return on Equity (ROE) over the five-year hold period. The Excel template for franchise unit cash flow projection indicates a payback period of 3 years, which is standard for high-CAPEX retail builds. While the initial cash outlay is significant, the steady climb to $927,000 in annual EBITDA by year five provides a strong exit or distribution multiple.
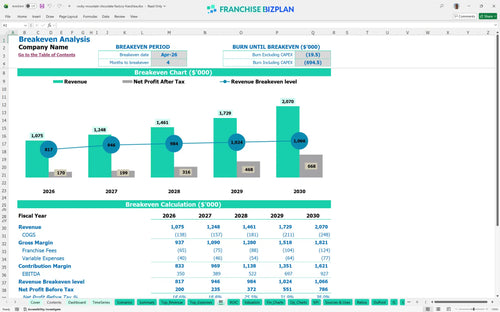
The unit reaches its monthly break-even point in April 2026, just four months after the initial launch phase. This break-even analysis assumes you hit your targets for artisanal chocolates and caramel apples, which are the primary volume drivers. Rent is your largest fixed burden at $12,000, so hitting your daily traffic counts in the historic district is the fastest way to cover your overhead.
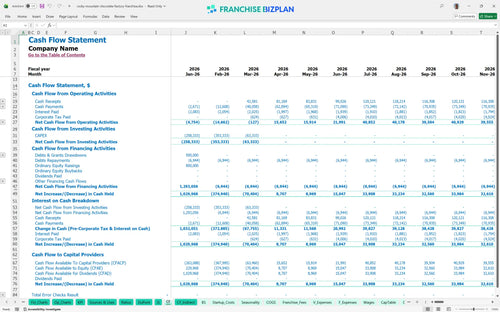
The lowest cash point occurs in March 2026, with a minimum cash requirement of $585,000 to sustain operations through the ramp-up. You need enough runway to cover franchise operational costs and the $18,500 in monthly fixed expenses before the wedding favor and gift box revenue streams fully kick in. Honestly, having a small buffer is smart in case the $350,000 build-out hits unexpected contractor delays.
Using best practices for retail franchise financial forecasting, we see that a 10% drop in revenue pushes the payback period past year four. Conversely, the high-growth scenario, driven by strong wedding favor demand, can double your year-one EBITDA. This retail store revenue forecasting shows that your margin is sensitive to labor productivity, especially with a $65,000 manager and $58,000 master chocolatier on the payroll.
This franchise financial model template is a flexible Excel tool designed to handle the specific unit economics of a confectionery retail business. You can adjust every assumption from product mix to hourly wages, ensuring the financial model template for food and beverage franchises matches your specific territory and local market conditions.

This franchise business plan template provides a detailed five-year outlook, projecting revenue to grow from $1.07M in year one to over $2.07M by year five. It maps out the long-term scalability of the unit, allowing multi-unit operators to see how store-level EBITDA scales as the location matures and gift box demand increases.

Managing franchise royalty fees is critical for maintaining margins, and this tool automates those calculations based on your gross sales. By analyzing franchise royalty and marketing fees in Excel, you can see exactly how the 5% royalty and 1% marketing fund impact your bottom line across different revenue tiers.

Our franchise startup cost calculator breaks down the total initial investment, including the $350,000 leasehold improvement budget and $100,000 in production equipment. This section helps you understand how to calculate startup costs for a retail franchise while identifying the exact sales volume needed to cover your $12,000 monthly rent.

This model uses franchise unit economic modeling for high-traffic retail to set realistic expectations for labor and occupancy costs. By comparing your projected 11% chocolate ingredient cost against industry standards, you can ensure your franchise unit economics spreadsheet reflects a competitive and sustainable operation.


Simply purchase and download the financial model template, then access it instantly using Microsoft Excel or Google Sheets. No installation or technical expertise required-just open and start working.

Enter your business-specific numbers, including revenue projections, costs, and investment details. The pre-built formulas will automatically calculate financial insights, saving you time and effort.

Leverage the investor-ready format to confidently showcase your financial projections to banks, franchise representatives, or investors. Impress stakeholders with clear, data-driven insights and professional reports.

Leverage the investor-ready format to confidently present your projections to banks, franchise representatives, or investors.