


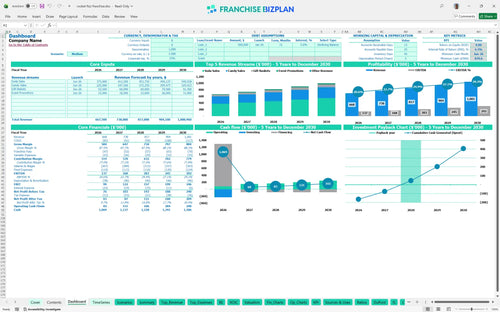
All-in-one Dashboard
Core inputs and core outputs



This franchise unit financial model template provides a complete Excel framework for projecting revenue, expenses, and investment returns for a specialty retail operation.
Core inputs and core outputs
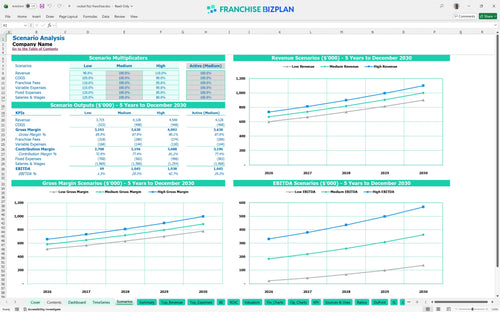
Three scenario analysis
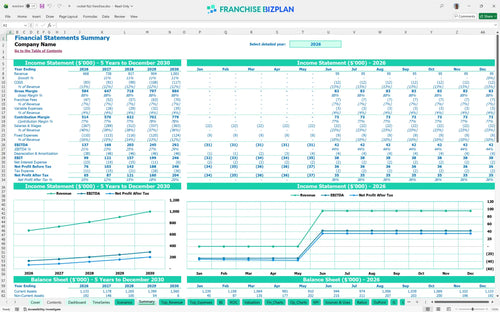
Presentation ready
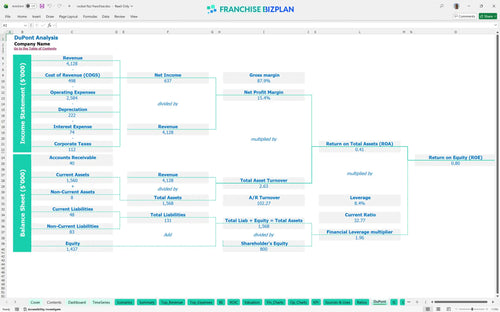
DuPont analysis
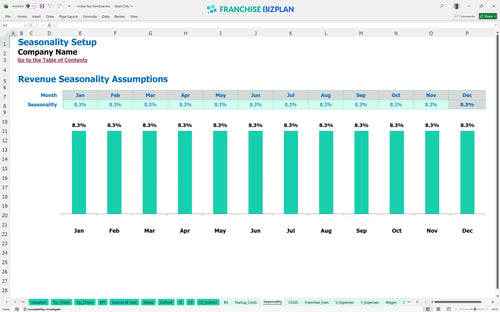
Researched revenue assumptions
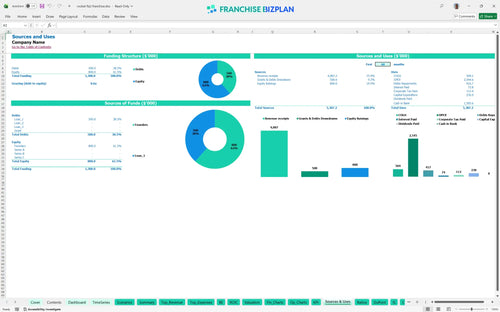
Lender-friendly financial outputs
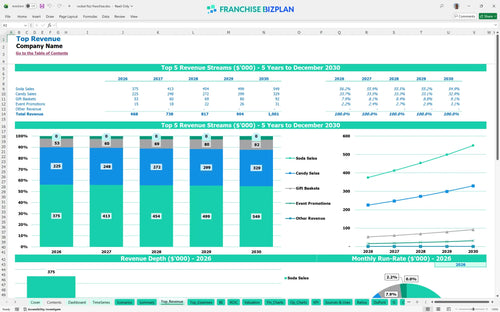
Revenue stream detailed view
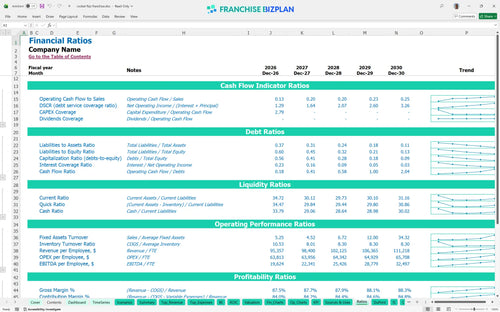
Performance metrics benchmark
We built this specialty retail financial model using our own research into destination candy and soda shops. Key assumptions like the $25,000 franchise fee, 5% royalty, and $6,000 monthly rent are pre-populated and fully editable. With a projected Year 1 EBITDA of $137,000, this tool helps you validate if the unit economics work for your specific territory.
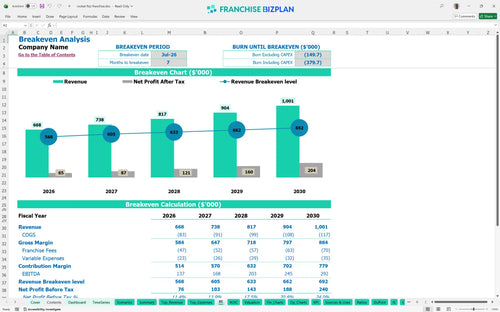
The model shows this unit hits its break-even date in July 2026, just seven months after launch. By Year 2, EBITDA is projected to reach $168,000 after accounting for the 7% total franchise fees and merchandise costs. Honestly, hitting these numbers depends on maintaining that 10.8% inventory cost as you scale.
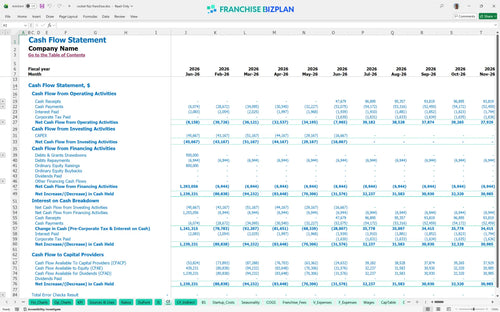
You need a total of $230,000 to get the doors open, plus enough working capital to handle the $879,000 minimum cash need projected for June 2026. This covers the $25,000 franchise fee and the heavy $100,000 build-out cost. Defintely keep an eye on that mid-year cash dip during the ramp-up phase.
The model projects a 3-year payback period and an Internal Rate of Return (IRR) of 4.34%. While the ROE sits at 0.8, the steady climb in EBITDA to $292,000 by Year 5 shows the long-term value of the location. Here's the quick math: you are trading upfront CAPEX for a stabilized cash-flowing asset by month 36.
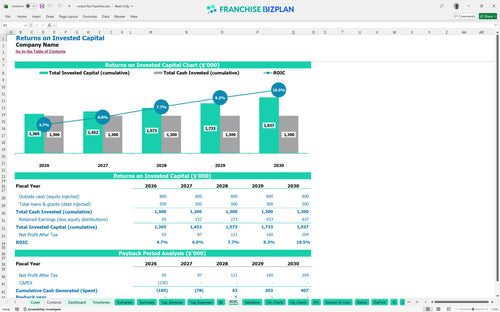
You need to hit break-even by month 7 to stay on track with the July 2026 target. The biggest drag on your break-even point is the $6,000 monthly rent and the $229,000 annual payroll. If foot traffic drops, you will need to lean harder on high-margin gift baskets to cover those fixed costs.
Your lowest cash point hits in June 2026 at $879,000, which includes your initial investment and operating losses during the first few months. You need to ensure your capital stack covers this valley before the July break-even. If leasehold improvements go 20% over budget, that cash buffer disappears fast.
The model compares scenarios to see how a drop in soda sales affects your Year 1 margin. In a high-growth case, hitting $1 million in revenue by Year 5 pushes EBITDA to $292,000. The difference between a struggling unit and a top performer usually comes down to labor productivity and managing that 11% merchandise cost.
Finance: update unit break-even and payback model by Friday.
This franchise unit financial model is fully customizable in Excel, allowing you to swap out every assumption to fit your specific market. You can adjust the $6,000 monthly rent or the 11% merchandise cost to see how it hits your bottom line. It is built for speed so you can test different scenarios without breaking the math.

We mapped out a five-year path showing revenue climbing from $668,000 to over $1 million. This gives you a clear view of how scaling your inventory and staff impacts long-term cash flow. It is about seeing the big picture before you sign the lease or commit to a second territory.

The model bakes in the 5% royalty and 2% marketing fund right off the top. At $668,000 in Year 1 sales, that means roughly $46,760 leaves the store before you pay a single employee or utility bill. Understanding these ongoing franchise-specific obligations is vital for protecting your store-level margin.

You will need to account for $230,000 in initial capital, including $100,000 for leasehold improvements and $50,000 for custom shelving. The model shows you exactly when your daily sales cover these fixed costs. Knowing your break-even point helps you manage the early months when cash pressure is highest.

We used real-world retail data to set the baseline for things like a 1.5% packaging cost and 2.5% payment processing fees. These benchmarks act as a sanity check for your budget. If your labor costs spike above the planned $229,000 for Year 1, you will know you are off-track immediately.


Simply purchase and download the financial model template, then access it instantly using Microsoft Excel or Google Sheets. No installation or technical expertise required-just open and start working.

Enter your business-specific numbers, including revenue projections, costs, and investment details. The pre-built formulas will automatically calculate financial insights, saving you time and effort.

Leverage the investor-ready format to confidently showcase your financial projections to banks, franchise representatives, or investors. Impress stakeholders with clear, data-driven insights and professional reports.

Leverage the investor-ready format to confidently present your projections to banks, franchise representatives, or investors.