
All-in-one Dashboard
Core inputs and core outputs


This franchise financial model template for Excel provides a complete toolkit for analyzing store-level performance and long-term investment potential.
Core inputs and core outputs
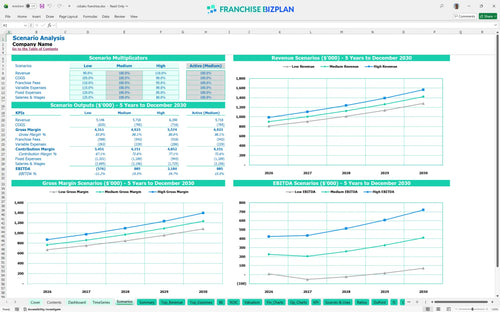
Three scenario analysis
Presentation ready
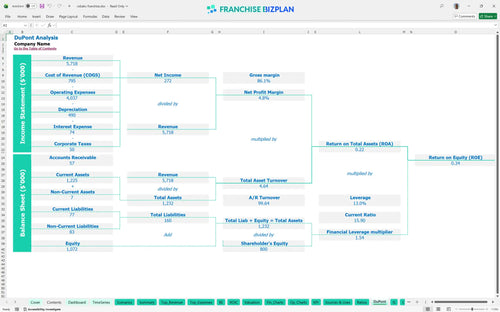
DuPont analysis
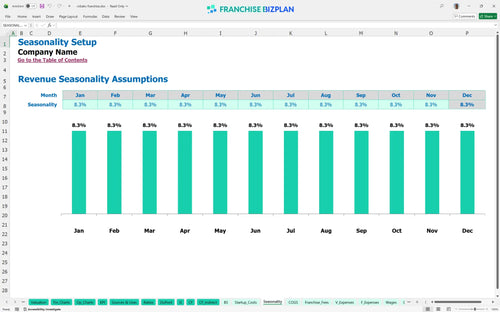
Researched revenue assumptions
Lender-friendly financial outputs
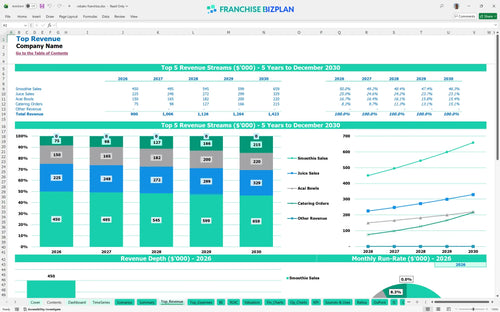
Revenue stream detailed view
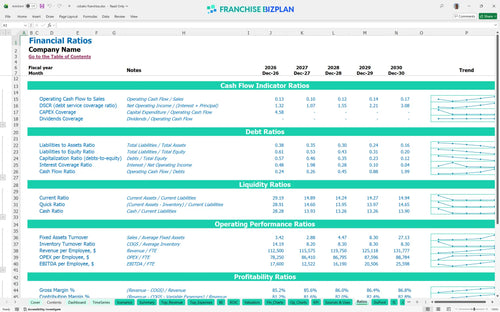
Performance metrics benchmark
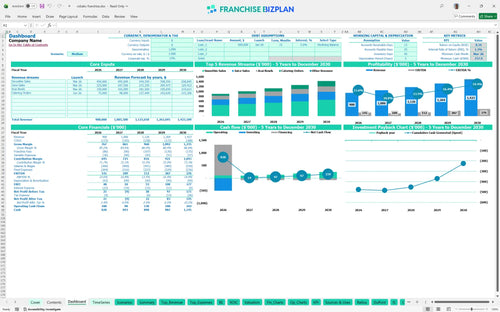
We built this franchise unit financial model using our own research into healthy food concepts. Key assumptions, such as the $900,000 Year 1 revenue and 7% royalty fee, are pre-populated with researched data and are fully editable. This tool helps you map out everything from the $497,000 initial investment to the 4-month break-even timeline.
The unit is projected to reach profitability by April 2026, just four months after opening. After accounting for COGS, a 7% royalty, and fixed costs like the $13,000 monthly rent, EBITDA is expected to grow from $141,000 in Year 1 to $276,000 by Year 5.
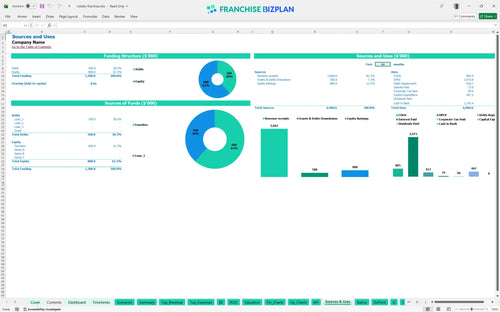
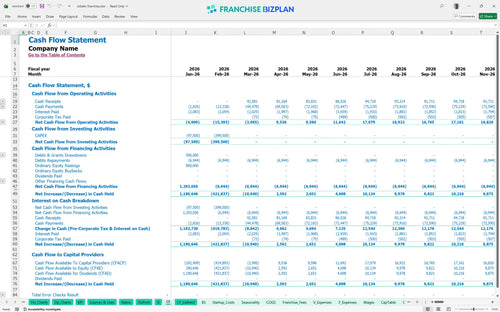
Launching this unit in the US requires $497,000 in initial CAPEX, including the $30,000 franchise fee and $220,000 for leasehold improvements. To maintain a safe runway, the model suggests a minimum cash requirement of $758,000 by March 2026.
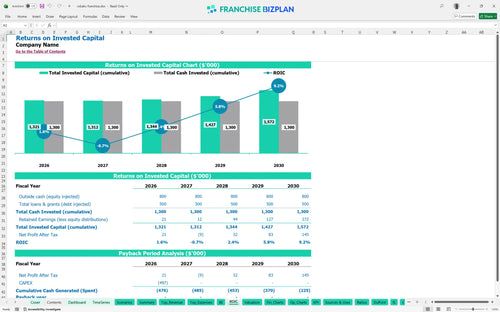
This franchise investment return calculator estimates an Internal Rate of Return (IRR) of 1.29% and a Return on Equity (ROE) of 0.34. While the full payback occurs after Year 5, the steady increase in annual EBITDA provides a reliable cash flow stream for multi-unit operators.
The monthly break-even point is reached in April 2026 when revenue covers the $13,000 rent and other fixed costs. Your juice bar profit margin analysis shows that managing labor and food costs-currently around 13%-is the biggest lever for hitting this goal faster.
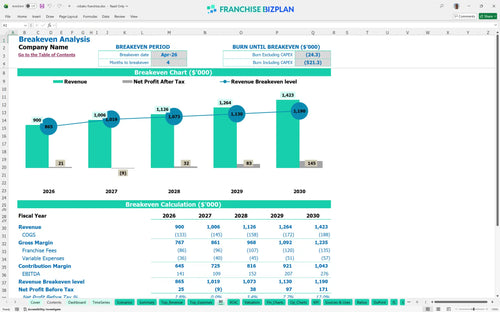
The lowest cash point is $758,000 in March 2026, highlighting the need for significant startup capital requirements for healthy food franchises. A detailed smoothie shop operating expense breakdown ensures you have enough runway to handle the initial four-month ramp-up period.
Financial forecasting for new franchise owners shows that a 10% increase in catering sales can significantly pull forward your ROI. Conversely, the low-case scenario helps you prepare for slower traffic by identifying which fixed expenses can be trimmed to protect your cash position.
This franchise financial model is fully customizable in Excel, allowing you to adjust every variable from local labor rates to specific lease terms. The pre-filled formulas and editable assumptions make it simple to adapt the smoothie shop business plan to your specific territory and local market conditions.

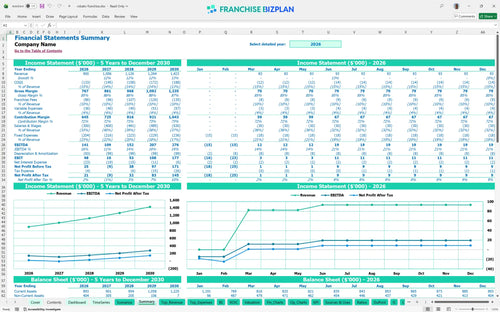
Long-term planning is essential for understanding juice bar profitability over time. This tool provides detailed 5-year revenue projections and cash flow statements, helping you see how the unit scales from its initial launch to a mature, high-performing location.

The model accurately captures your ongoing financial obligations to the franchisor, including the 7% royalty and 2.5% marketing fund contributions. This ensures your franchise P&L statement reflects the true cost of doing business under a national brand umbrella.

Knowing how to calculate startup costs for a smoothie franchise is critical for securing funding. This section breaks down your $497,000 initial investment and identifies the monthly operational expenses required to reach your break-even sales target.

We defintely included industry benchmarks to help you perform a realistic unit economic analysis. These figures allow you to compare your projections against standard ranges, helping you learn how to create a pro forma for a juice franchise that stands up to lender scrutiny.


Simply purchase and download the financial model template, then access it instantly using Microsoft Excel or Google Sheets. No installation or technical expertise required-just open and start working.

Enter your business-specific numbers, including revenue projections, costs, and investment details. The pre-built formulas will automatically calculate financial insights, saving you time and effort.

Leverage the investor-ready format to confidently showcase your financial projections to banks, franchise representatives, or investors. Impress stakeholders with clear, data-driven insights and professional reports.

Leverage the investor-ready format to confidently present your projections to banks, franchise representatives, or investors.