
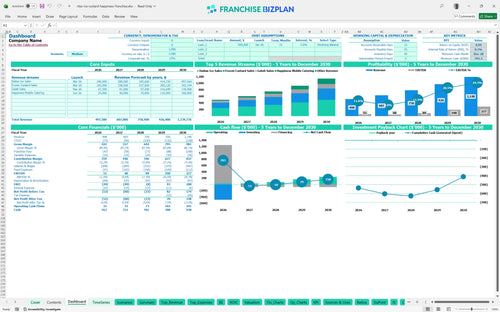
All-in-one Dashboard
Core inputs and core outputs


This comprehensive Excel spreadsheet for franchise cash flow projection includes detailed tabs for revenue modeling, payroll planning, CAPEX tracking, and a full set of 5-year financial statements.
Core inputs and core outputs
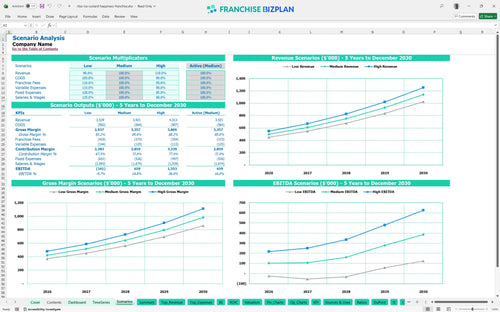
Three scenario analysis
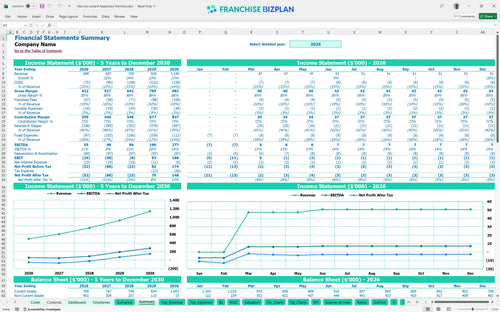
Presentation ready
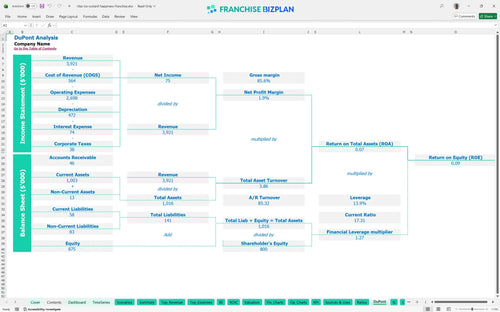
DuPont analysis
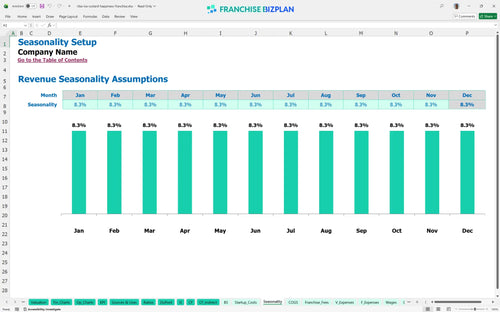
Researched revenue assumptions
Lender-friendly financial outputs
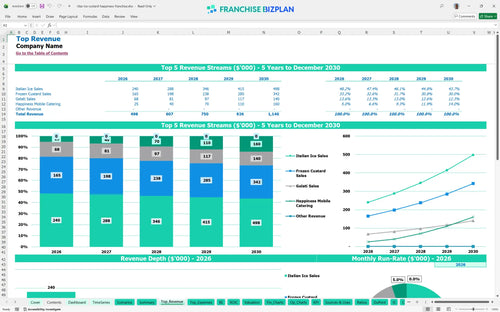
Revenue stream detailed view
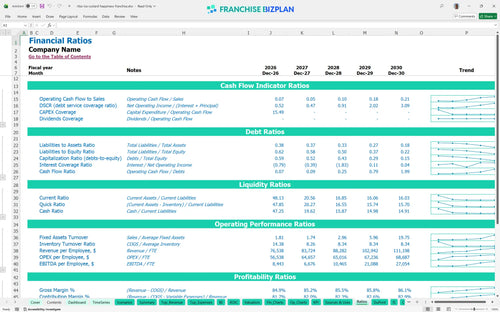
Performance metrics benchmark
We built this franchise unit financial model using our own research to ensure it reflects the reality of a high-volume dessert shop. Key assumptions like Italian Ice sales starting at $160,000 and the $55,000 Store Manager salary are pre-populated and fully editable to match your specific territory. This financial model template for small franchise owners gives you a head start on your business plan.
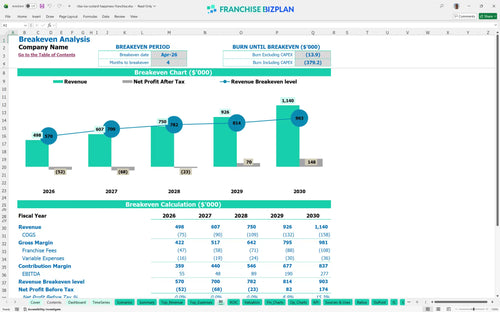
The unit becomes profitable in its first year with a projected EBITDA of $55,000, which grows to $277,000 by year five. We estimate this by subtracting COGS, the 9.5% royalty/marketing burden, and fixed costs like the $5,500 monthly rent from your total revenue streams.
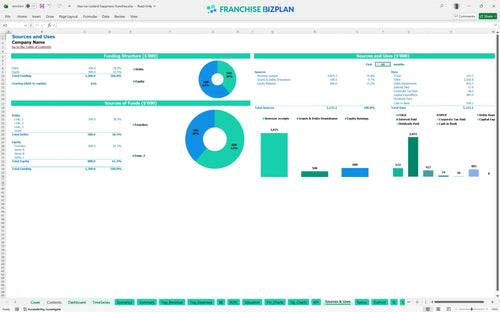
Launching this franchise unit in the US requires a total initial investment driven by $220,000 in leasehold improvements and $95,000 for specialized equipment. Your startup budget spreadsheet for quick service restaurants also accounts for the $35,000 franchise fee and the $55,000 mobile vehicle for catering.
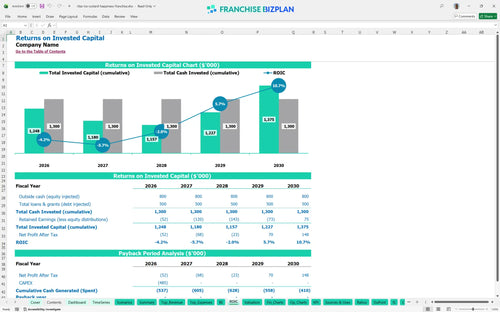
A franchisee can expect an Internal Rate of Return (IRR) of 27% and a Return on Equity (ROE) of 0.09 based on the 5-year forecast. The franchise investment return calculator template shows that while annual EBITDA is strong, the high initial build-out means the payback period occurs after year five.
The monthly break-even point is reached in April 2026, just four months after the March launch. The key driver for hitting this target is maintaining Italian Ice and Frozen Custard volume to cover the $5,500 rent and the 31.2% total labor cost burden.
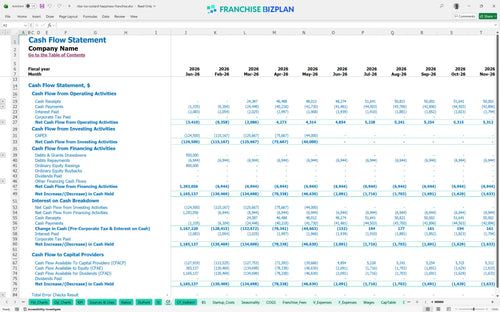
The lowest cash point occurs in December 2028 at $701,000, indicating a need for strong working capital management during the ramp-up phase. We defintely recommend keeping a cash buffer to handle seasonal dips in Florida foot traffic or delays in mobile catering bookings.
Moving from a Medium to a High scenario by increasing revenue by 10% significantly improves your year-one EBITDA margin. The model shows how sensitive your peak cash need is to changes in food ingredients, which start at 13.5% of sales, and the scaling of your crew member headcount.
This financial forecasting for ice cream and custard shops provides the data-driven foundation you need to secure financing or approve a new territory. It turns abstract brand promises into a concrete franchise business plan Excel document that you can actually execute. Use this to finalize your unit economics before committing to a long-term lease.
Finance: update unit break-even and payback model by Friday.
This franchise financial model template is built in Excel with editable assumptions, so you can swap out rent or labor costs as your local market dictates. It uses pre-filled formulas to link your revenue drivers directly to your cash flow, making it easy to test different what-if scenarios before you sign a lease. This tool is a must-have for any ice cream shop profitability calculator you might be building.

Planning for a single window is one thing, but scaling to a multi-unit operation requires a franchise unit financial projection that looks five years out. This model tracks your climb from $498,000 in year one to over $1.1M by year five, accounting for both retail foot traffic and mobile catering expansion. It provides a clear ROI analysis for long-term investors.

We baked the specific cost structure analysis for retail food franchise into the math, including the 6.5% royalty and 3% marketing fund. These off-the-top costs can eat into your store-level margin if you aren't careful, so the model calculates them automatically against your gross sales. It is the most accurate way to handle franchise royalty fees in your planning.

Figuring out how to calculate startup costs for a dessert franchise is the first hurdle, from the $35,000 initial fee to the $220,000 in leasehold improvements. This tool identifies your break-even sales estimates, showing you exactly when your daily Italian ice and custard volume starts covering the $5,500 monthly rent. It simplifies capital expenditure planning for new owners.

Use our built-in benchmarks to see if your 13.5% food cost or your crew member staffing levels align with industry standards for quick-service dessert shops. It is a reality check that helps you spot margin leaks in your operating budget template for food service franchise before they become cash flow crises. This helps in analyzing franchise unit economics for investors.


Simply purchase and download the financial model template, then access it instantly using Microsoft Excel or Google Sheets. No installation or technical expertise required-just open and start working.

Enter your business-specific numbers, including revenue projections, costs, and investment details. The pre-built formulas will automatically calculate financial insights, saving you time and effort.

Leverage the investor-ready format to confidently showcase your financial projections to banks, franchise representatives, or investors. Impress stakeholders with clear, data-driven insights and professional reports.

Leverage the investor-ready format to confidently present your projections to banks, franchise representatives, or investors.