
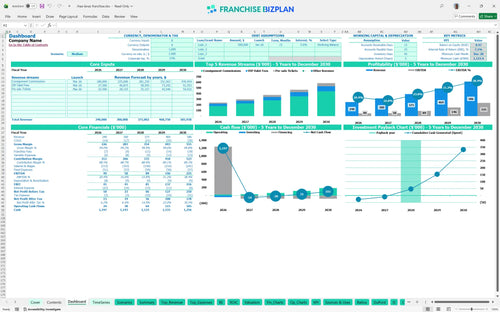
All-in-one Dashboard
Core inputs and core outputs


This franchise unit financial model template provides a professional-grade Excel model for children's consignment franchise business plan development, covering everything from initial capex to five-year cash flow.
Core inputs and core outputs
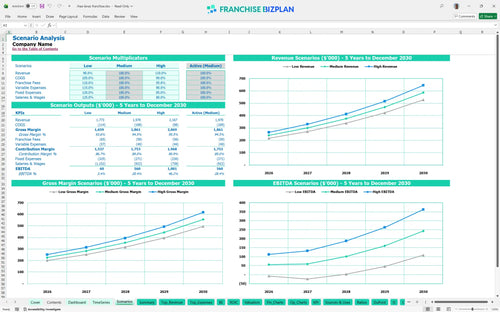
Three scenario analysis
Presentation ready
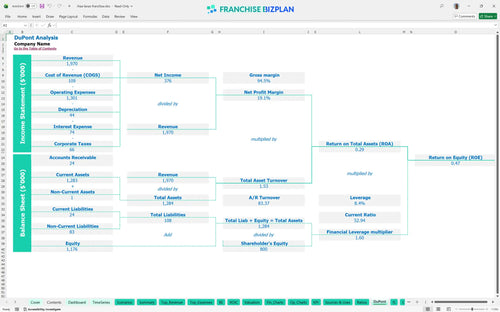
DuPont analysis
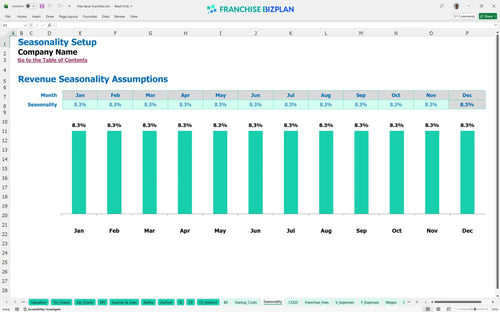
Researched revenue assumptions
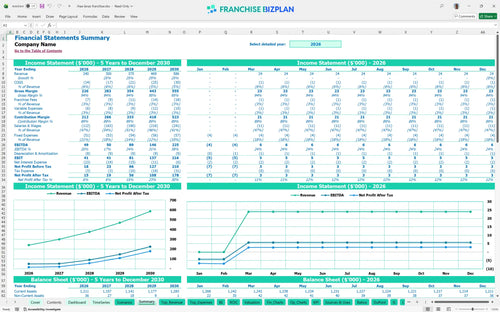
Lender-friendly financial outputs
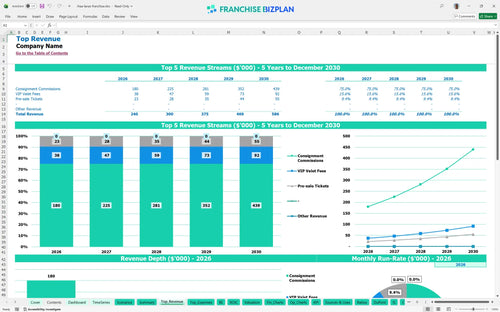
Revenue stream detailed view
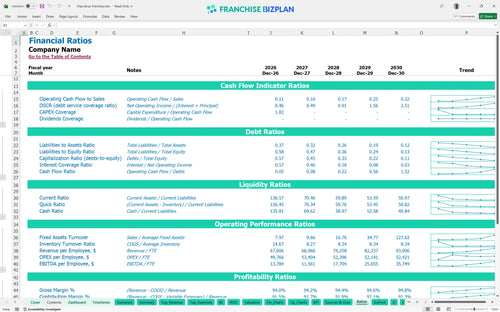
Performance metrics benchmark
We built this franchise unit financial model using our own research into the boutique consignment event planning space. Key assumptions like the $120,000 initial consignment commission revenue and the $48,000 event manager salary are pre-populated with researched data specific to Rhea Lana's Franchise franchise unit and are fully editable. This helps you move past the guessing phase and into a data-driven startup financial feasibility study for boutique retail.
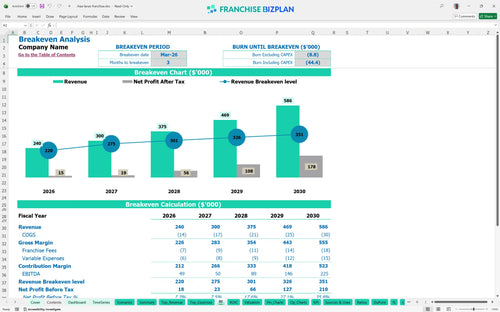
This unit hits its stride quickly, reaching break-even by March 2026, just three months after launch. With year-one EBITDA projected at $49,000 on $240,000 in sales, the model shows a clear path to profitability. By year five, as revenue climbs toward $586,000, the store-level margin expands significantly because fixed costs like the $2,200 venue lease stay flat while volume grows. Efficiency is the key to scaling.
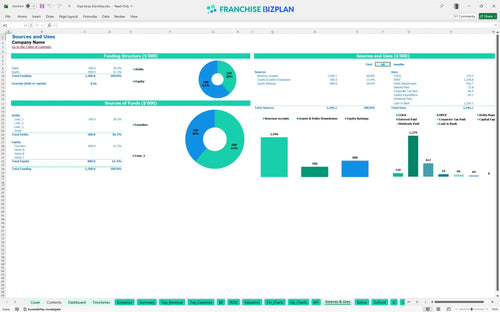
You will need approximately $44,100 in initial capital to cover the core startup costs. This includes the $19,500 franchise fee and about $24,600 for equipment and pre-opening marketing. Since the model shows a three-year payback, you aren't just spending money; you are deploying it into an asset that generates cash relatively quickly. Still, keep a small buffer for the first few months of operations. Cash is king during the launch.
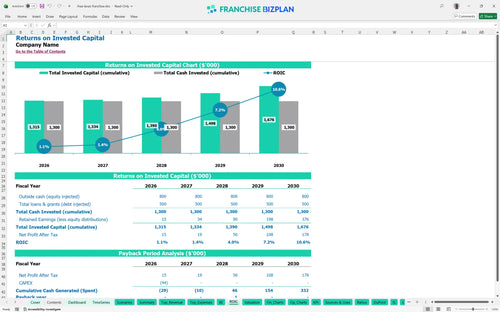
The franchise investment ROI calculator shows an Internal Rate of Return (IRR) of 7.08% and a Return on Equity (ROE) of 0.47. With a three-year payback period, the model suggests a stable return for a semi-annual retail pop-up events model. While the IRR might look modest, the cash-on-cash return improves as the assistant manager and crew become more efficient at handling higher inventory volumes in later years. Patience pays off in resale.
The break-even date is set for March 2026, which is month three of the forecast. To cover fixed costs like the $2,200 venue lease and $4,250 in monthly salaries, you need to clear about $20,000 in monthly revenue. The biggest lever here is the consignment commission; if your average ticket or item count drops, you will need to lean harder on VIP Valet fees to cover the nut. Volume solves most retail problems.
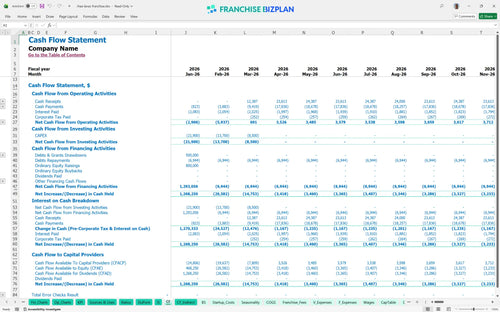
The lowest cash point occurs in December 2028, showing a minimum cash balance of $1,123. This is a tight spot that suggests you need to manage your working capital closely during the ramp-up. Even though the unit is profitable, the timing of semi-annual payouts and venue deposits can create temporary pressure. We recommend keeping an extra $5,000 in reserve to handle these timing gaps. Watch your cash like a hawk.
Switching between Low, Medium, and High scenarios changes your year-one EBITDA from $49,000 to significantly different figures based on throughput. In the High case, increasing VIP Valet fees and ticket sales can pull the payback period under 30 months. Conversely, the Low case shows that if revenue drops by 20%, the $1,123 cash floor could turn negative, requiring more upfront investment. Plan for the worst, work for the best.
This franchise unit financial model template is built in Excel with open formulas, so you can tweak every variable to fit your specific territory. Whether you are adjusting the local venue lease or shifting labor hours for a three-day event, the logic remains intact. It is a retail franchise profitability analysis tool that lets you swap out pre-filled data for your own local market realities without breaking the math. Every territory is different, so flexibility is your best friend here.

Planning a children's consignment franchise business plan requires looking past the first pop-up event. This model provides a full 5-year view, mapping revenue growth from $240,000 in year one to over $580,000 by year five. You get a clear look at how store-level EBITDA scales as you build a local consignor base and improve throughput. It defintely helps you see the transition from a startup phase to a mature, high-volume operation. Growth is a marathon, not a sprint.

We baked the franchise royalty fee structure directly into the cash flow so you can see the impact on your bottom line. With a 3% royalty and 0% marketing fund, the model tracks exactly how much goes to the franchisor every month. This ensures your retail franchise profitability analysis accounts for every dollar of top-line drag before you calculate your take-home pay. Honestly, knowing your fixed obligations is the only way to manage a clean margin. Fees are the price of a proven system.

Understanding how to calculate startup costs for a resale franchise is the first step to avoiding a cash crunch. This tool aggregates everything from the $19,500 franchise fee to the $6,500 for display racks and $4,800 for POS systems. It then maps these against your margins to find the exact month you stop burning cash. For this model, break-even hits in just three months, which is fast for any retail concept. Speed to profit is the ultimate goal.

This model uses real-world numbers for things like event supplies and packaging materials, which start around 6% of sales combined. By using these benchmarks, you can sanity-check your own estimates for labor and rent. If your venue lease is way higher than the $2,200 monthly average, the model shows you exactly how much more volume you need to maintain your margins. Benchmarks keep your projections grounded in reality. Don't guess when you can benchmark.


Simply purchase and download the financial model template, then access it instantly using Microsoft Excel or Google Sheets. No installation or technical expertise required-just open and start working.

Enter your business-specific numbers, including revenue projections, costs, and investment details. The pre-built formulas will automatically calculate financial insights, saving you time and effort.

Leverage the investor-ready format to confidently showcase your financial projections to banks, franchise representatives, or investors. Impress stakeholders with clear, data-driven insights and professional reports.

Leverage the investor-ready format to confidently present your projections to banks, franchise representatives, or investors.