
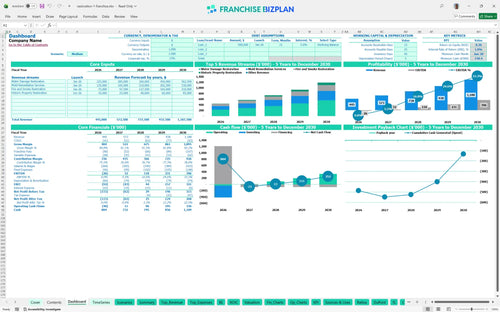
All-in-one Dashboard
Core inputs and core outputs


This franchise unit financial model template provides a data-driven framework to project revenue, manage restoration-specific expenses, and track long-term ROI.
Core inputs and core outputs
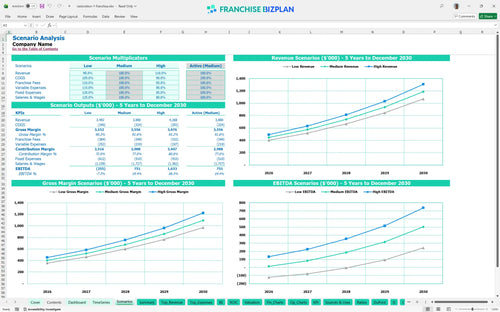
Three scenario analysis
Presentation ready
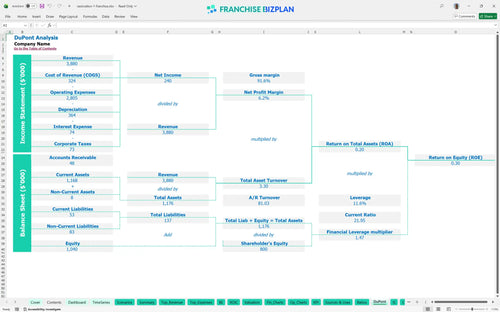
DuPont analysis
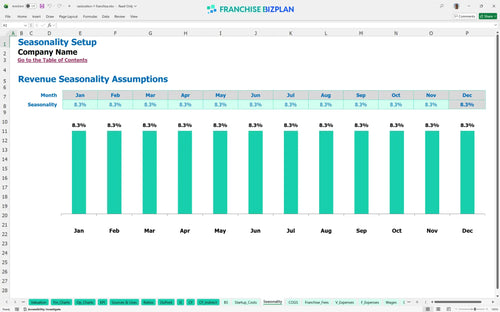
Researched revenue assumptions
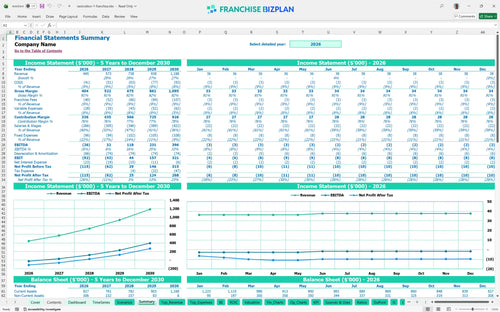
Lender-friendly financial outputs
Revenue stream detailed view
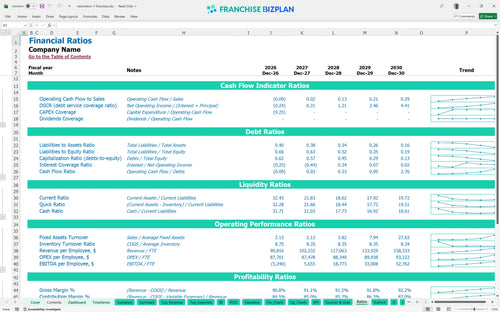
Performance metrics benchmark
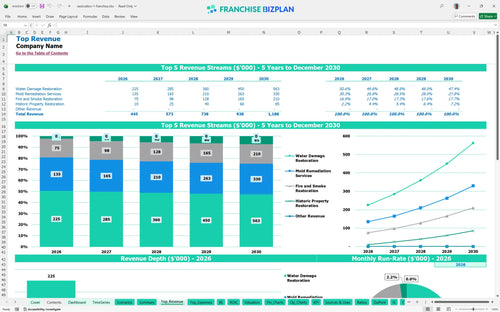
We built this franchise unit financial model using our own research to provide a realistic roadmap for new operators. Key assumptions, including the $445,000 year-one revenue target and the 7% royalty structure, are pre-populated with researched data specific to this restoration franchise unit and are fully editable to match your local market. This tool tracks your path from a year-one EBITDA loss of $26,000 to a year-five profit of $396,000, ensuring you understand the timing of your return.
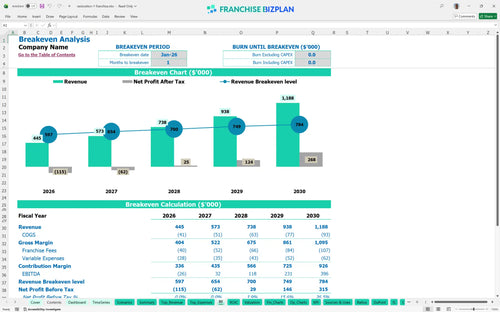
The unit is projected to reach positive EBITDA in its second year of operation, moving from a $26,000 loss in year one to a $32,000 profit in year two. By year five, net profit scales significantly as the business matures and the revenue from mold remediation and water damage restoration hits a combined $1,188,000 annually.
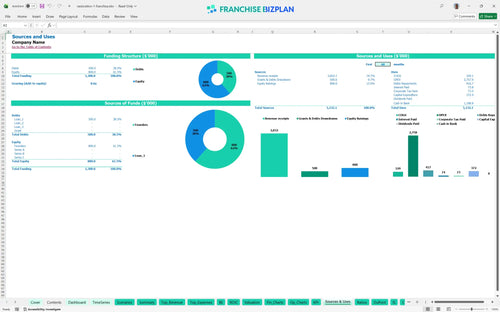
Launching this unit requires a total initial investment covering the $59,900 franchise fee, $110,000 for facility setup, and $126,000 for three response vehicles. Including specialized thermal imaging equipment and moisture detection tools, the startup costs are intensive, and the model suggests a minimum cash requirement of $730,000 to handle the ramp-up and working capital needs through the first two years.
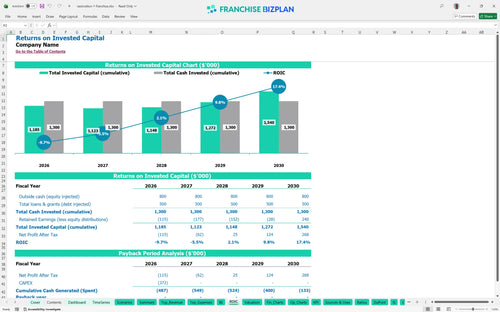
Investors can expect an Internal Rate of Return (IRR) of 1.01% and a Return on Equity (ROE) of 0.3 over the initial five-year period. While the payback period extends beyond year five, the unit builds significant value, reaching an annual EBITDA of $396,000 by the end of the projection, which supports a strong exit multiple or long-term cash flow play.
The business is designed to reach a monthly break-even point by January 2026, just one month after the full launch of primary services. This rapid break-even depends heavily on maintaining a consistent volume of water damage restoration jobs and managing the fixed $4,000 monthly facility rent alongside the 9% combined royalty and marketing fee burden.
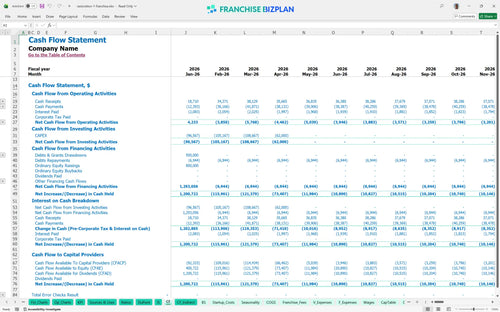
The lowest cash point is projected to be $730,000 in January 2028, which means you defintely need a robust capital cushion during the first 24 months of operation. This runway accounts for the hiring of a General Manager at $75,000 and the gradual scaling of the restoration crew from 1.5 to 3.5 full-time equivalents as job volume increases.
In an emergency restoration business plan, the high-case scenario is driven by faster penetration into the historic property restoration market and higher average tickets for mold remediation. Moving from the medium to high scenario can pull profitability forward and increase the year-one margin, whereas a low-revenue scenario would increase the peak cash need and delay the $396,000 EBITDA milestone.
Finance: update unit break-even and payback model by Friday.
This franchise financial model template is built in Excel with fully editable assumptions and pre-filled formulas, allowing you to adjust every driver to your specific territory. Whether you are modeling a single unit in a high-density suburb or a multi-unit expansion, you can easily modify the revenue inputs, staffing schedules, and local overhead to reflect your actual operating environment.

Planning for long-term sustainability requires more than just a first-year estimate, so this franchise unit economic model provides a detailed 5-year outlook. You can track the progression from initial launch through the ramp-up phase, seeing how revenue is projected to grow from $445,000 in year one to over $1,188,000 by year five as your local reputation and referral networks mature.

Understanding franchise royalty and marketing fund costs is critical for protecting your store-level margins and ensuring you have enough cash for local operations. This model automatically calculates the 7% royalty fee and 2% marketing fund contribution based on your monthly revenue, providing a clear view of the total brand-related expenses you will pay to the franchisor over the life of the agreement.

Knowing how to calculate startup costs for a restoration franchise is the first step toward securing financing and managing your initial runway. The model breaks down the $59,900 franchise fee and $110,000 facility setup alongside equipment needs, helping you identify the exact sales volume required each month to cover your fixed facility costs and variable restoration expenses.

We have integrated franchise unit financial performance metrics to help you sanity-check your projections against industry standards for damage restoration. From monitoring restoration material costs-which start at 7.8% of revenue-to tracking labor efficiency for your technicians, these benchmarks ensure your business plan remains realistic and aligned with high-performing units in the network.


Simply purchase and download the financial model template, then access it instantly using Microsoft Excel or Google Sheets. No installation or technical expertise required-just open and start working.

Enter your business-specific numbers, including revenue projections, costs, and investment details. The pre-built formulas will automatically calculate financial insights, saving you time and effort.

Leverage the investor-ready format to confidently showcase your financial projections to banks, franchise representatives, or investors. Impress stakeholders with clear, data-driven insights and professional reports.

Leverage the investor-ready format to confidently present your projections to banks, franchise representatives, or investors.