
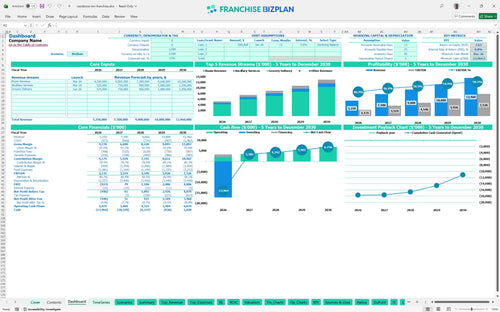
All-in-one Dashboard
Core inputs and core outputs


This Excel template for hotel franchise financial forecasting includes pre-built sheets for revenue modeling, expense tracking, and full five-year financial statements.
Core inputs and core outputs
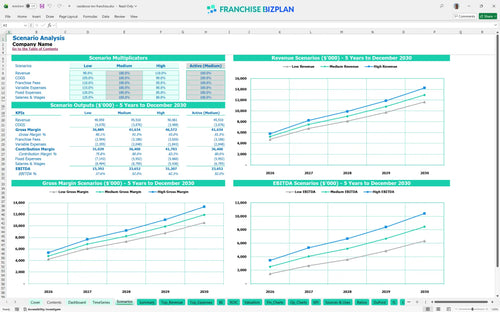
Three scenario analysis
Presentation ready
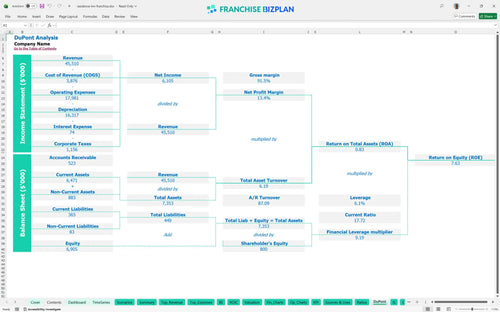
DuPont analysis
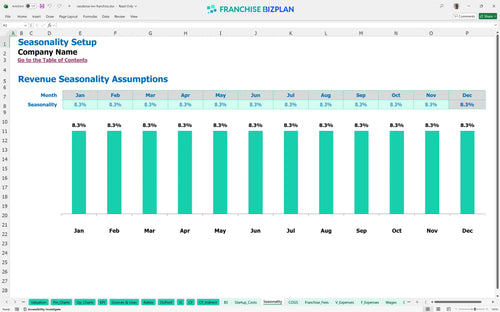
Researched revenue assumptions
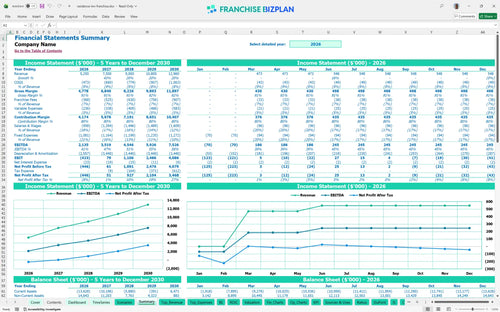
Lender-friendly financial outputs
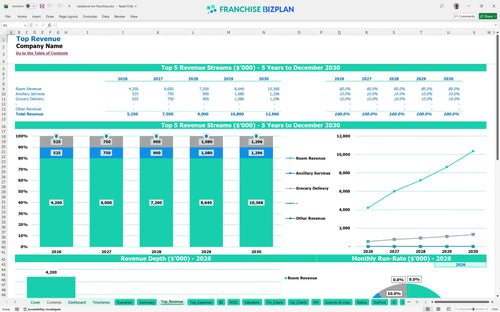
Revenue stream detailed view
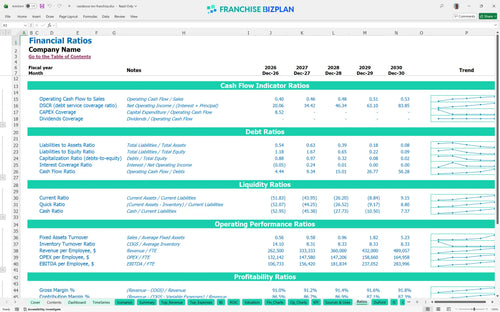
Performance metrics benchmark
We developed this hotel franchise business plan template to provide a realistic look at the numbers behind a premium extended stay hotel investment. The assumptions, including the $5.25 million year-one revenue and the $17.2 million startup cost breakdown for full-service extended stay hotels, are pre-populated with researched data and are fully edittable. This tool helps you perform a financial feasibility study for hotel franchise owners by mapping out every dollar from room revenue to grocery delivery fees.
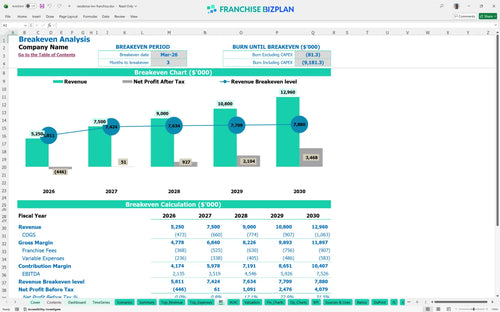
This franchise unit reaches the break-even point in March 2026, just three months after the launch date. By year two, EBITDA is projected at $3.5 million, but you must manage the 6% royalty and 1% marketing fund contributions to protect your store-level margin as you scale to $12.9 million in annual sales by year five.
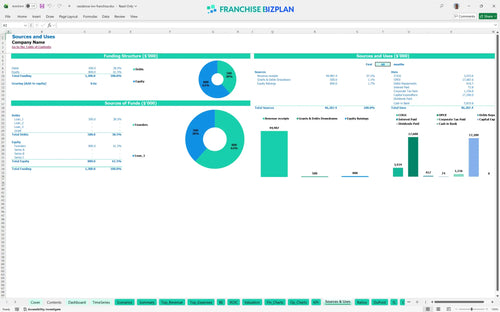
Launching this unit requires a total startup investment of $17.2 million, which includes the $90,000 franchise fee and $8 million for building construction. Your capital expenditure planning must also account for the $13.9 million minimum cash requirement during the initial ramp-up phase to ensure you have enough runway before the March 2026 break-even.
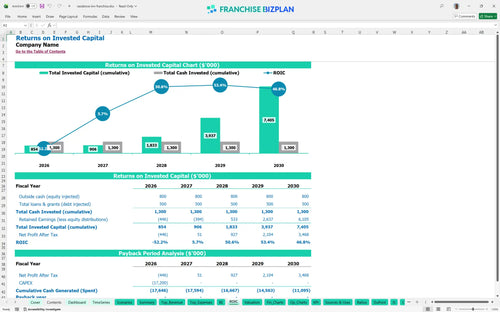
The ROI analysis shows an Internal Rate of Return of 0.79 and a Return on Equity of 7.63. While the payback period defintely extends beyond five years due to the massive $17.2 million entry cost, the hotel franchise revenue stream analysis suggests a mature unit can generate over $7.5 million in annual EBITDA.
Monthly break-even occurs when revenue covers the $45,000 lease rent and $12,000 in monthly property taxes. The model indicates this happens in March 2026, provided you maintain a steady average ticket and manage the 3% OTA commissions that can quickly eat into your room revenue margins.
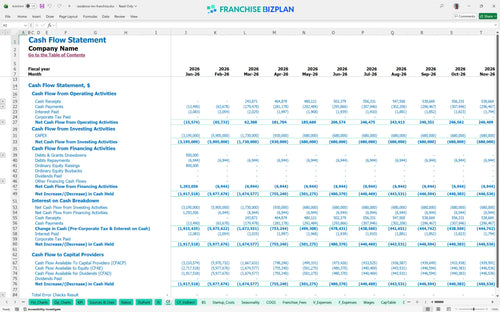
The lowest cash point is $13.9 million in December 2026, highlighting the need for robust budgeting for hospitality franchise development. You should maintain a cash buffer to handle the timing gaps between the $160,000 preopening expenses and the ramp-up to the $7.5 million year-two revenue target.
Using the franchise unit profitability analysis tool, you can see how a 10% drop in room revenue delays your break-even and increases the peak cash need. High-performance scenarios focus on maximizing the $864,000 grocery delivery revenue by year five while keeping guest amenities supplies at the benchmarked 5.2% of sales.
Finance: update unit break-even and payback model by Friday.
This hotel franchise financial model is built in Excel, allowing you to tweak every variable from room rates to occupancy levels. All formulas are unlocked, so you can adjust the pre-filled data to match your specific territory or local market conditions. Every 1-point margin leak matters fast in a high-CAPEX model.

Map out your hospitality business financial projections with a full five-year view. The model tracks revenue scaling from $5.25 million in year one to over $12.9 million by year five, giving you a clear picture of long-term scalability. What this estimate hides is the timing gap between construction and full occupancy.

Managing the franchise royalty fee structure is critical for store-level margin. This tool calculates the 6% royalty and 1% marketing fee automatically against your projected room revenue and ancillary sales. At $5.25 million in sales, about $367,500 goes to the franchisor before you cover your Austin-based overhead.

Use the franchise startup cost calculator to account for the $17.2 million initial investment. It tracks everything from the $90,000 franchise fee to the $8 million building construction cost to find your path to profitability. Break-even depends less on headline sales and more on managing the $45,000 monthly rent.

Compare your operational cost modeling for corporate lodging franchises against hospitality industry benchmarks. We've included standards for labor and guest amenities to ensure your guest amenities supplies-starting at 6% of revenue-stay competitive. If labor runs higher than the planned $150,000 GM salary, margins tighten quickly.


Simply purchase and download the financial model template, then access it instantly using Microsoft Excel or Google Sheets. No installation or technical expertise required-just open and start working.

Enter your business-specific numbers, including revenue projections, costs, and investment details. The pre-built formulas will automatically calculate financial insights, saving you time and effort.

Leverage the investor-ready format to confidently showcase your financial projections to banks, franchise representatives, or investors. Impress stakeholders with clear, data-driven insights and professional reports.

Leverage the investor-ready format to confidently present your projections to banks, franchise representatives, or investors.