
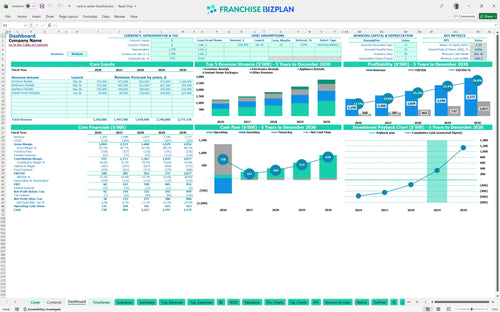
All-in-one Dashboard
Core inputs and core outputs


This comprehensive tool provides a ready-to-use framework for analyzing the full lifecycle of a retail rental location from launch to maturity.
Core inputs and core outputs
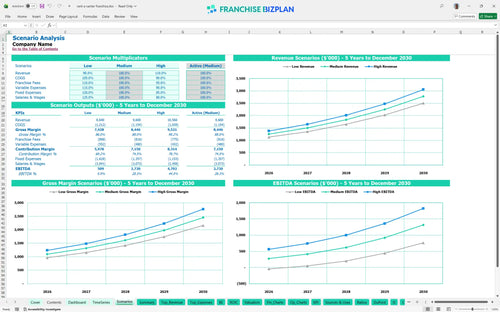
Three scenario analysis
Presentation ready
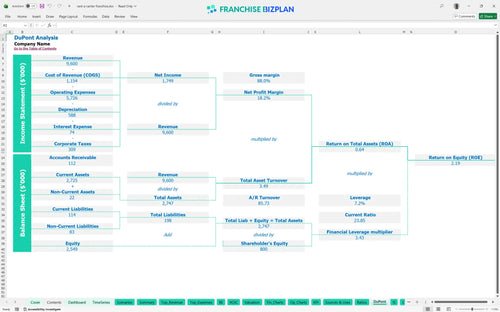
DuPont analysis
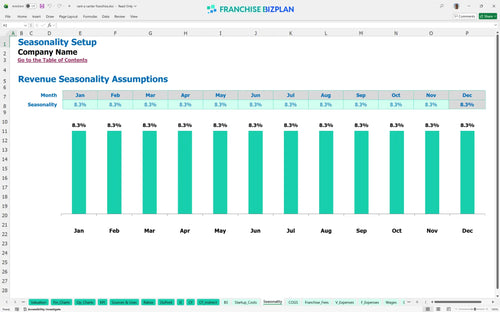
Researched revenue assumptions
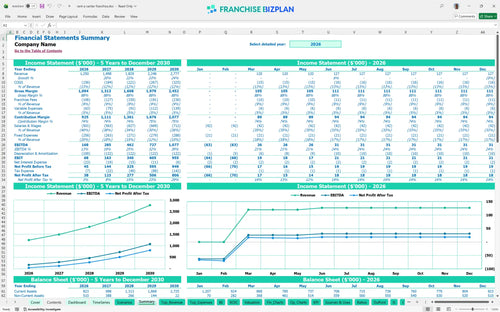
Lender-friendly financial outputs
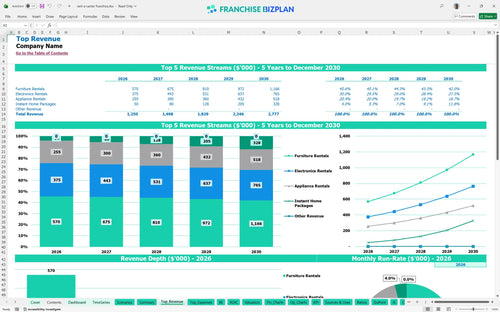
Revenue stream detailed view
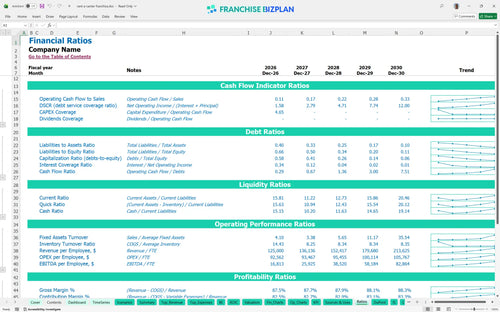
Performance metrics benchmark
We built this model using detailed research on the rent-to-own business model to ensure every line item reflects reality. Key assumptions like lease-to-own revenue streams and inventory depreciation are pre-populated but fully editable to fit your specific territory. Estimating profitability for rent-to-own businesses is much easier when you start with a year one EBITDA target of $168,000 already modeled out. This is defintely the fastest way to get your numbers in front of a lender.
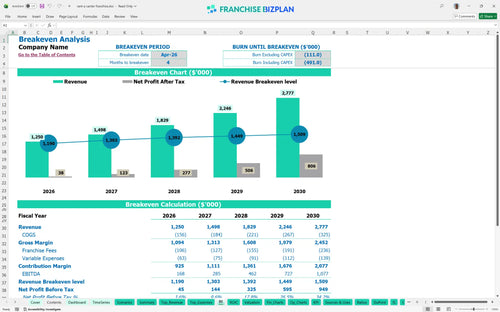
The unit is projected to reach its break-even date in April 2026, just four months after launch. By year two, the model shows an EBITDA of $285,000 after accounting for all royalties, delivery costs, and a full staff. Profitability scales significantly as the lease portfolio matures and customer buyouts increase.
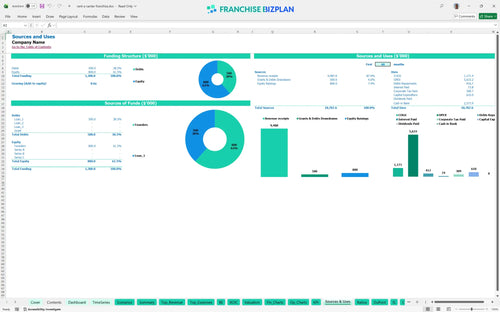
You will need a total initial investment that covers the $35,000 franchise fee and significant leasehold improvements of $220,000. This franchise startup cost analysis also includes $180,000 for initial inventory to stock the showroom. Using an excel template for franchise startup costs helps you track every dollar from the POS system to the delivery fleet.
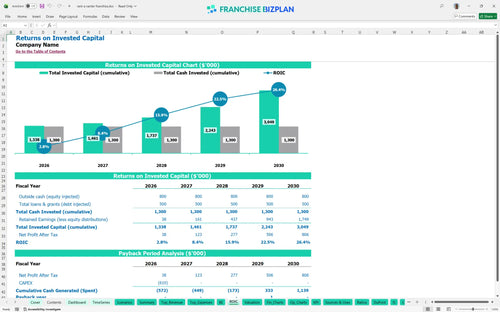
Investors can expect a 4-year payback period on their initial capital outlay. The model projects an Internal Rate of Return (IRR) of 4% and a Return on Equity (ROE) of 2.19. Assessing investment viability for furniture rental franchises requires looking at these long-term multiples alongside steady cash flow. A franchise ROI projection is only as good as the underlying traffic assumptions.
Calculating break-even for retail rental locations depends heavily on managing the $15,000 monthly rent and the 5.5% royalty burden. The model identifies the specific monthly revenue needed to cover these fixed costs plus the variable delivery and payment processing fees. Use the franchise profit margin calculator to see how a small increase in the average ticket shortens this timeline.
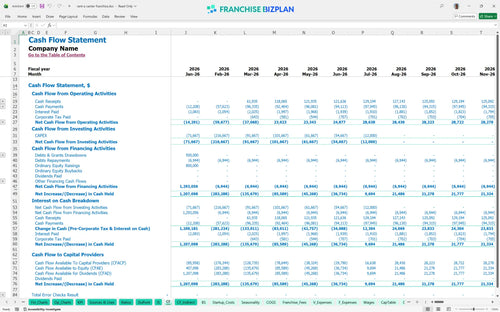
The lowest cash point is projected to be $621,000 in June 2026 during the initial ramp-up phase. Effective retail store cash flow management is vital during these first six months to ensure you have enough buffer for payroll and utilities. This operational expense forecasting helps you visualize the gap between opening costs and recurring lease revenue.
The rent-to-own franchise unit economic analysis tool allows you to toggle between Low, Medium, and High growth scenarios. Projecting cash flow for retail franchise operations under a 'High' case shows EBITDA climbing toward $1.07 million by year five. Even in a 'Low' case, the model helps you identify which fixed expenses to cut to stay cash-flow positive.
This franchise financial model template is built in Excel with open formulas and editable assumptions. You can easily adjust the revenue drivers, staffing levels, and local rent to see how they impact your bottom line. It is a practical tool for anyone learning how to create a financial model for a retail franchise without starting from a blank sheet.

Success in a retail franchise investment plan requires looking beyond the first year. This model provides a detailed 5-year outlook, showing how revenue scales from $1.25 million in year one to over $2.7 million by year five. It gives you the long-term financial forecasting for new franchise units needed to secure financing or plan multi-unit expansion.

Managing franchise royalties and operational expenses is critical for maintaining store-level margins. The model automatically calculates the 5.5% royalty and 3% marketing fee against your monthly revenue streams. This ensures you always know exactly how much cash is leaving the business for brand support before you pay your local bills.

The retail franchise business plan financial section must clearly outline the capital required to open the doors. This model breaks down the initial investment into clear categories like leasehold improvements and inventory. By mapping these against your franchise unit economics, you can see the exact sales volume required to cover your $15,000 monthly rent and other fixed costs.

We have integrated industry-specific benchmarks so you can compare your projections against typical performance in the sector. Whether you are looking at labor costs for delivery drivers or inventory depreciation rates, these benchmarks help you sanity-check your numbers. Use this to ensure your store-level EBITDA targets are realistic for your market.


Simply purchase and download the financial model template, then access it instantly using Microsoft Excel or Google Sheets. No installation or technical expertise required-just open and start working.

Enter your business-specific numbers, including revenue projections, costs, and investment details. The pre-built formulas will automatically calculate financial insights, saving you time and effort.

Leverage the investor-ready format to confidently showcase your financial projections to banks, franchise representatives, or investors. Impress stakeholders with clear, data-driven insights and professional reports.

Leverage the investor-ready format to confidently present your projections to banks, franchise representatives, or investors.