


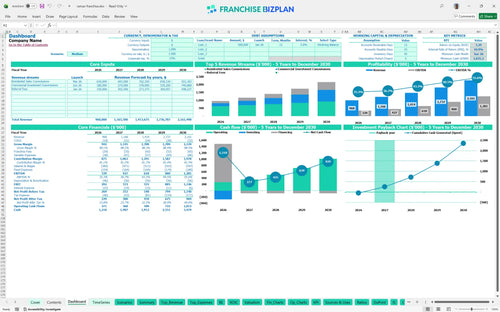
All-in-one Dashboard
Core inputs and core outputs



This template includes a comprehensive suite of financial tools including five-year projections, startup cost calculators, and detailed scenario analysis for a modern brokerage.
Core inputs and core outputs
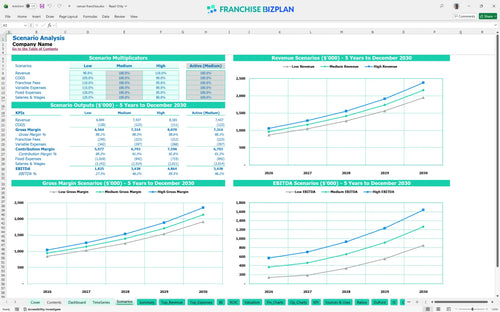
Three scenario analysis
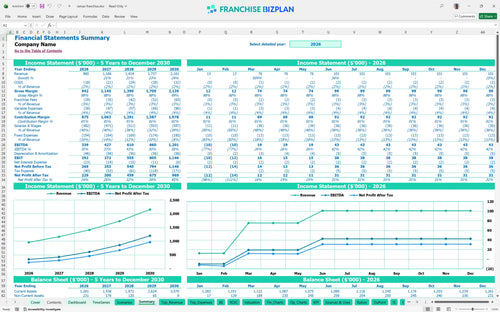
Presentation ready
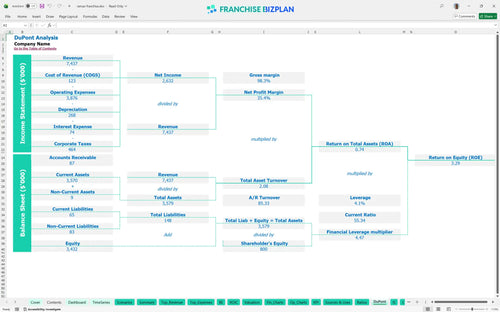
DuPont analysis
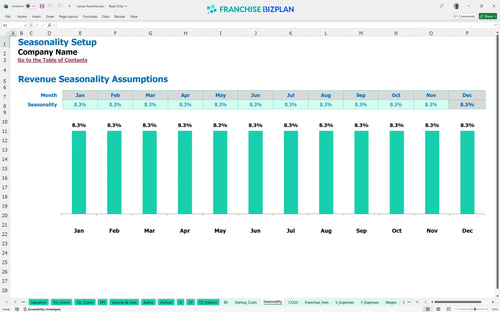
Researched revenue assumptions
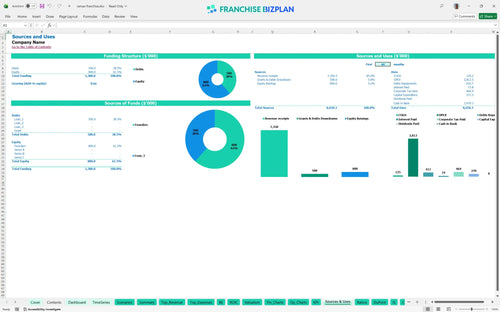
Lender-friendly financial outputs
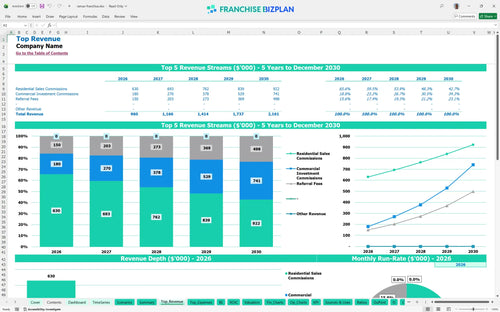
Revenue stream detailed view
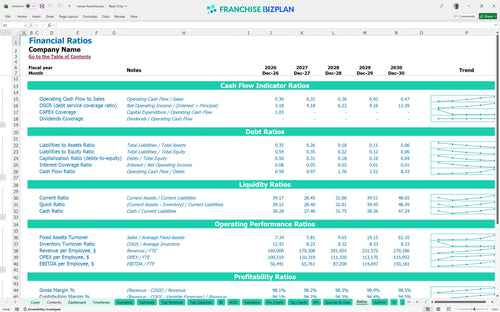
Performance metrics benchmark
We built this financial template for new real estate brokerage office using researched data on high-volume urban territories. Key assumptions like the $17,500 franchise fee and the $110,000 managing broker salary are pre-populated and fully editable. With a year-one revenue target of $960,000, this model provides a realistic roadmap for scaling a boutique-style agency under a global brand.
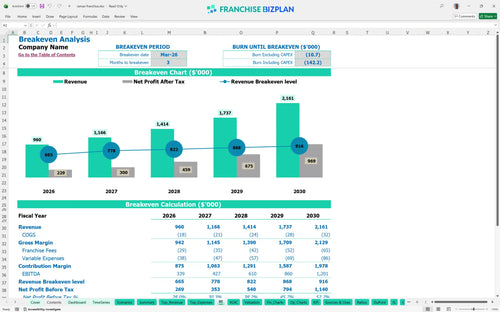
This unit hits full accounting profitability by March 2026, just three months after opening. By year two, the real estate commission revenue model forecasts an EBITDA of $427,000 after accounting for all royalties, marketing fees, and the $13,300 in monthly fixed operating costs.
You need $277,500 for the initial build-out and fees, plus a $1,035,000 cash floor to maintain operations. This ensures you can cover the $110,000 managing broker salary and $8,500 prime location rent during the early months of capital expenditure planning and launch.
Investors can expect a 10.91% internal rate of return and a full capital payback within 24 months. The franchise investment ROI is defintely efficient compared to other service-based models, especially as revenue scales toward $2.16 million by year five.
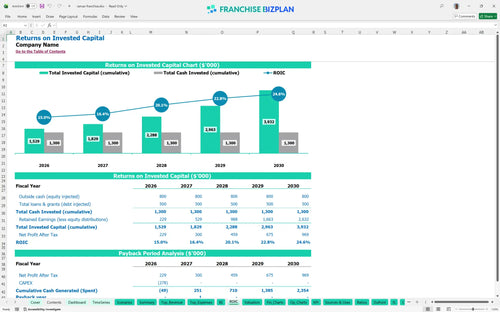
The monthly break-even point is reached when commission revenue covers approximately $44,550 in fixed overhead and franchise fees. Learning how to forecast revenue for a real estate franchise unit accurately is the only way to ensure your volume stays above this critical threshold.
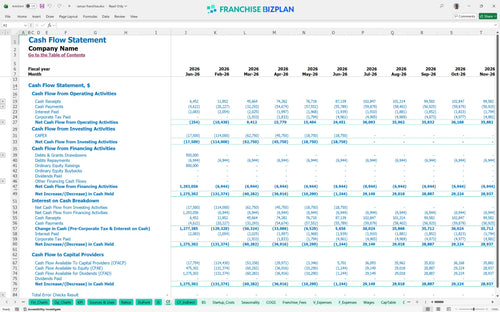
The lowest cash point occurs in June 2026, requiring a minimum liquidity of $1,035,000 to sustain the ramp-up. Using a real estate franchise cash flow projection tool helps you manage the timing gaps between closings and operational cost forecasting for your staff.
High-performance scenarios drive year-five EBITDA to $1.2 million, while low-performance cases delay payback beyond the 2-year mark. This real estate franchise business model excel spreadsheet lets you stress-test the franchise profitability analysis by adjusting revenue down or spiking estimating operating expenses for a boutique real estate agency. It is a vital tool for franchise financial planning for high-tech real estate agency owners who need to see the worst-case scenario before signing a lease.
Finance: update unit break-even and payback model by Friday.
This real estate franchise financial model is an Excel-based tool designed for quick adjustments to your specific market conditions. You can edit every assumption from agent commission splits to office overhead, ensuring the real estate agency financial forecast matches your local territory reality. Honestly, the ability to tweak your own numbers is what makes this tool actually useful for a real-world operator.

Planning for a long-term exit or multi-unit expansion requires a clear view of the next 60 months. This model tracks revenue scaling from $960,000 in year one to over $2.16 million by year five, providing a detailed real estate brokerage profit and loss statement template. It calculates store-level EBITDA (earnings before interest, taxes, depreciation, and amortization) so you can see exactly when the unit starts generating serious cash.

Managing the 1% royalty and 2% marketing fee is critical for maintaining store-level margins. The model automates the franchise royalty fee calculation based on your gross commission income, so you always know exactly what is owed to the brand before you pay your brokers or yourself. Still, keeping an eye on these off-the-top costs is the only way to protect your bottom line in a high-volume model.

Launching a brokerage requires significant upfront capital, including $100,000 for leasehold improvements and $75,000 for specialized tech hardware. This franchise startup cost spreadsheet helps you identify the exact month you stop burning cash, which according to our data, happens around March 2026. Knowing how to calculate startup costs for a real estate franchise correctly prevents nasty surprises during the build-out phase.

We include standard benchmarks for labor and occupancy to help you perform a financial feasibility study for real estate franchise operations. If your $8,500 monthly rent or $110,000 managing broker salary deviates too far from industry norms, the model flags it so you can adjust your real estate brokerage business plan accordingly. To be fair, benchmarks are just a guide, but they are great for a sanity check.


Simply purchase and download the financial model template, then access it instantly using Microsoft Excel or Google Sheets. No installation or technical expertise required-just open and start working.

Enter your business-specific numbers, including revenue projections, costs, and investment details. The pre-built formulas will automatically calculate financial insights, saving you time and effort.

Leverage the investor-ready format to confidently showcase your financial projections to banks, franchise representatives, or investors. Impress stakeholders with clear, data-driven insights and professional reports.

Leverage the investor-ready format to confidently present your projections to banks, franchise representatives, or investors.