


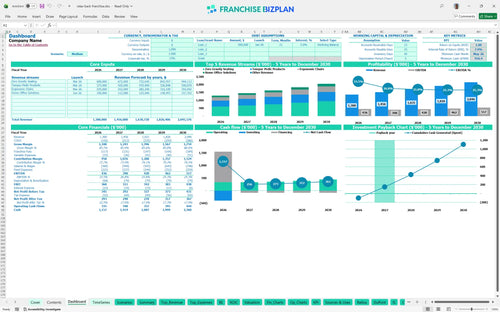
All-in-one Dashboard
Core inputs and core outputs



This franchise unit financial model template provides a complete Excel-based framework for projecting revenue, expenses, and cash flow for a premium wellness retail location.
Core inputs and core outputs
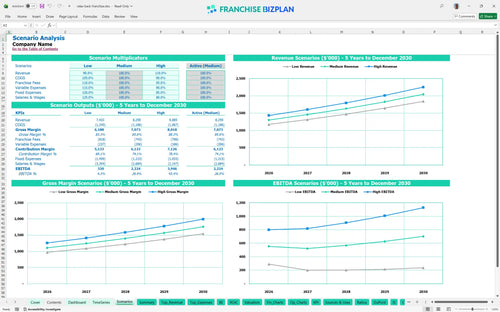
Three scenario analysis
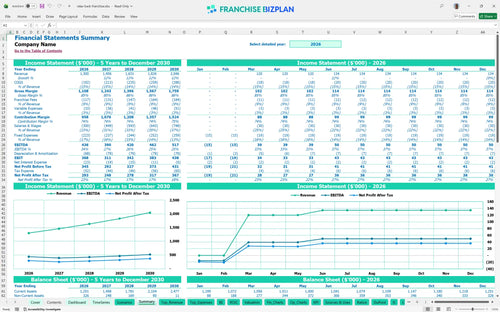
Presentation ready
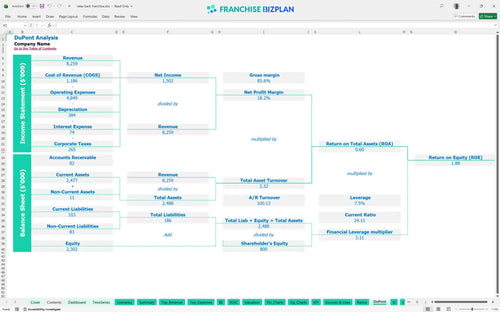
DuPont analysis
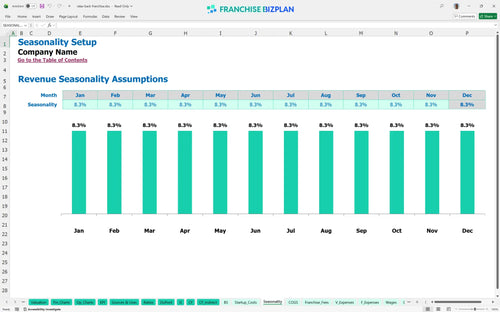
Researched revenue assumptions
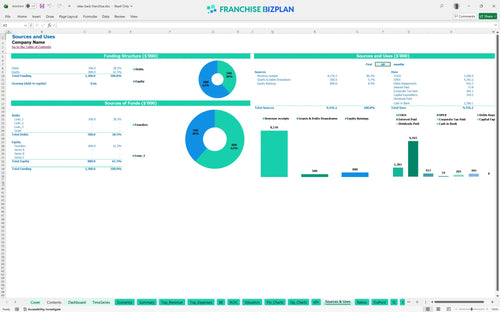
Lender-friendly financial outputs
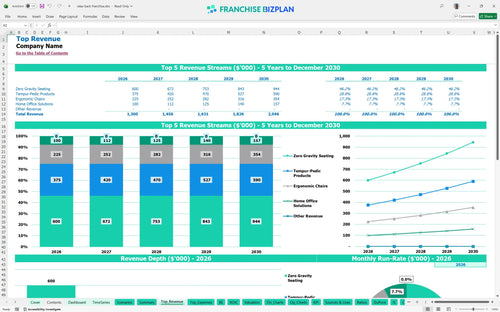
Revenue stream detailed view
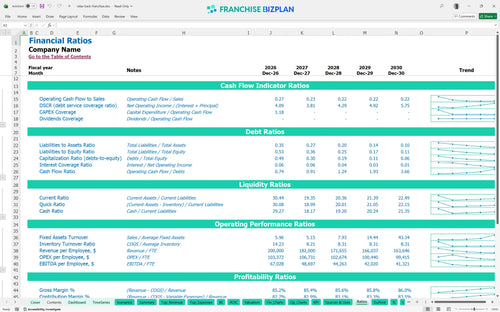
Performance metrics benchmark
We built this franchise unit financial model using detailed research into premium wellness retail operations. Key assumptions like the $1.3M year-one revenue target and the $394,500 initial CAPEX are pre-populated but fully editable to match your specific territory. With a projected 2-year payback and a 7.87% IRR, the model provides a realistic roadmap for navigating high-ticket sales cycles and specialized staffing needs.
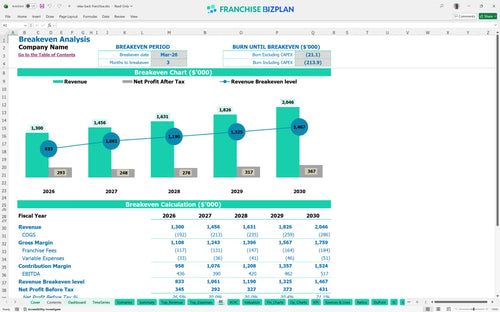
You can expect this unit to reach monthly break-even by March 2026, just three months after launch. Year-one EBITDA is projected at $436,000, which is strong for a retail startup, though it dips slightly in year two as you scale the wellness consultant team. The model accounts for the 9% total royalty and marketing burden while maintaining healthy margins through high-ticket items like Zero Gravity seating.
To get the doors open, you will need approximately $394,500 in initial capital, not including your opening inventory and working capital buffer. The largest outlays are the $175,000 for leasehold improvements and $60,000 for showroom fixtures to meet brand standards. The model shows a minimum cash requirement of $916,000 to safely navigate the ramp-up period through May 2026.
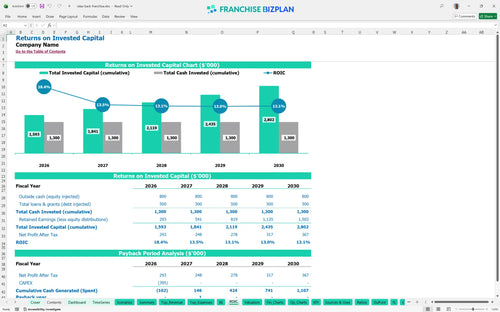
The model projects an Internal Rate of Return (IRR) of 7.87% and a Return on Equity (ROE) of 1.88 over the five-year period. Most importantly for cash-conscious owners, the total payback period is just 2 years. This assumes you hit the $1.3M revenue target in year one and manage the $12,000 monthly rent effectively.
You need to hit break-even by March 2026 to stay on track with the 2-year payback plan. The primary driver for break-even is sales volume of high-ticket items like Tempur-Pedic products, which are slated for $250,000 in year-one sales. With fixed costs at nearly $20,000 a month, maintaining a high average ticket is more critical than pure foot traffic.
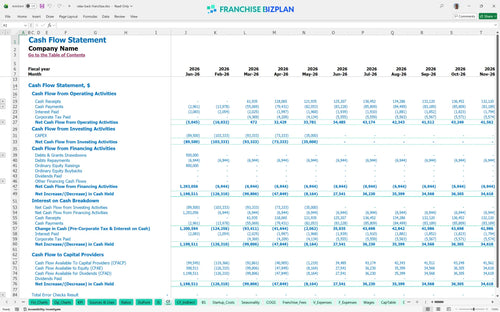
Your lowest cash point occurs in May 2026, about two months after the main revenue streams launch. The model suggests a minimum cash position of $916,000 to handle the gap between the $394,500 build-out and the ramp-up of sales. If your leasehold improvements run 20% over budget, that cash buffer becomes your most important asset.
In a low-revenue scenario, your break-even could push past mid-2026, significantly increasing your peak cash need. The high scenario, driven by strong local marketing and medical referrals, could see year-one EBITDA exceed $500,000. Because 9% of revenue goes to the franchisor regardless of profit, the difference between a medium and high case is almost entirely found in how you manage your $230,000 plus annual payroll.
Finance: update unit break-even and payback model by Friday
This franchise unit financial model lives in Excel, giving you total control over the numbers. You can swap out pre-filled data for your specific territory, adjusting everything from local rent to specific labor rates. It's built to handle the nuances of a high-ticket retail environment where inventory turns and consultant productivity drive the bottom line.

Mapping out five years of performance helps you see beyond the initial grand opening. The model projects revenue scaling from $1.3 million in year one to over $2 million by year five, accounting for market maturation and repeat referral business. You get a clear view of how cash flow evolves as you move from a single-unit startup to a stabilized wellness destination.

Operating within a system means accounting for the 5% royalty and 4% marketing fee off the top. This model calculates these costs automatically based on your monthly sales, ensuring you see the true store-level margin after brand contributions. It defintely helps to see how $117,000 in annual fees at $1.3M revenue impacts your ability to cover local fixed costs like rent and specialized labor.

Launching a premium showroom requires significant upfront capital, including $175,000 for leasehold improvements and $60,000 for fixtures. This retail franchise business plan identifies exactly when you hit the break-even point-estimated at month three-based on your fixed overhead of roughly $19,200 per month. Knowing your daily sales target to cover these costs is the difference between a stressed owner and a confident operator.

Use built-in benchmarks to see if your 13% inventory cost or 9% total franchise fees align with high-end retail norms. The model allows you to sanity-check your wellness consultant staffing levels against projected traffic. If your labor-to-revenue ratio drifts too high, the model flags it, helping you maintain the store-level EBITDA margins needed for a healthy return.


Simply purchase and download the financial model template, then access it instantly using Microsoft Excel or Google Sheets. No installation or technical expertise required-just open and start working.

Enter your business-specific numbers, including revenue projections, costs, and investment details. The pre-built formulas will automatically calculate financial insights, saving you time and effort.

Leverage the investor-ready format to confidently showcase your financial projections to banks, franchise representatives, or investors. Impress stakeholders with clear, data-driven insights and professional reports.

Leverage the investor-ready format to confidently present your projections to banks, franchise representatives, or investors.