
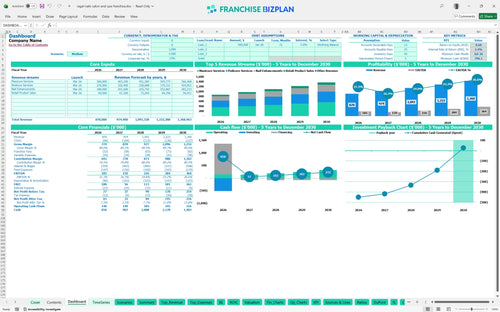
All-in-one Dashboard
Core inputs and core outputs


This comprehensive Excel template provides everything a franchisee needs to forecast revenue, manage startup costs, and analyze five-year profitability for a retail service unit.
Core inputs and core outputs
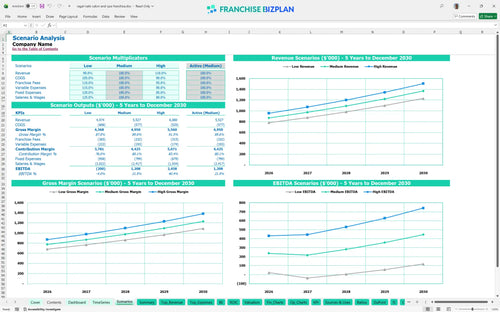
Three scenario analysis
Presentation ready
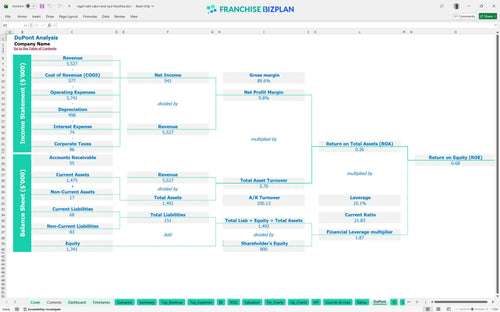
DuPont analysis
Researched revenue assumptions
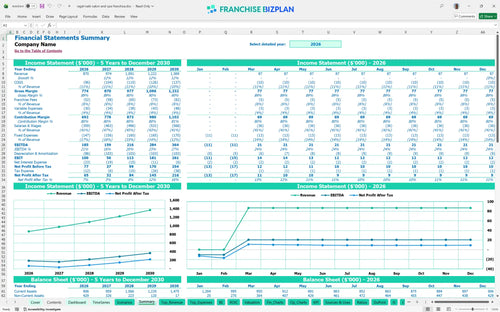
Lender-friendly financial outputs
Revenue stream detailed view
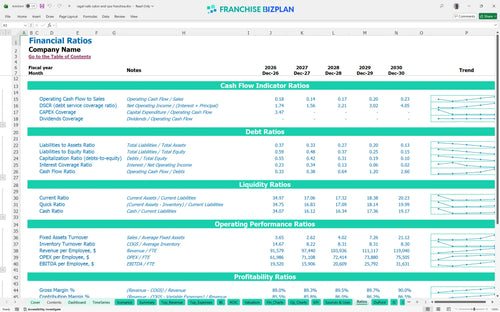
Performance metrics benchmark
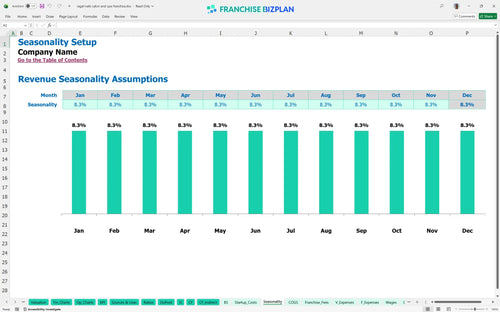
We built this nail salon franchise financial model using our own research into the express luxury beauty sector. Key assumptions including revenue streams, operating expenses, staffing, and the $515,000 in initial capital investments are pre-populated with researched data specific to the Regal Nails Salon & Spa Franchise franchise unit and are fully editable. This model tracks the $870,000 Year 1 revenue target and the $185,000 EBITDA to ensure your investment stays on track from day one.
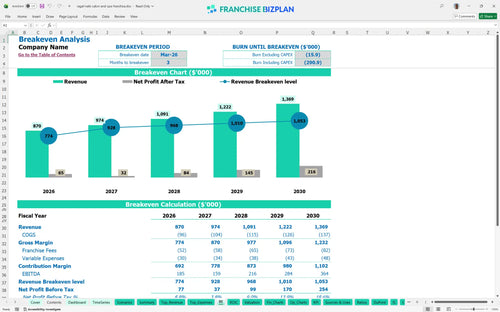
This franchise unit becomes profitable very quickly, reaching its break-even point in March 2026, just three months after launch. By Year 1, the model projects an EBITDA of $185,000 after accounting for the 6% royalty, $9,000 monthly rent, and technician wages. Every chair-hour lost is margin you never get back.
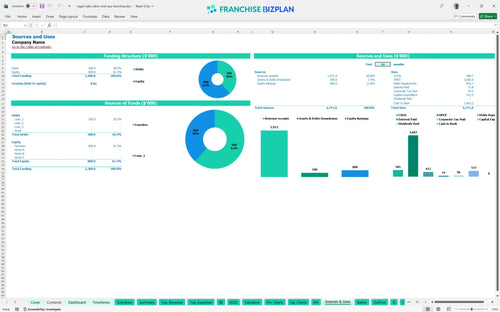
You need approximately $515,000 in upfront capital to cover the franchise fee and build-out, plus a cash buffer. The total investment is allocated across leasehold improvements, equipment, and initial fees, with the lowest cash point of $796,000 occurring in July 2026 during the initial ramp-up phase.
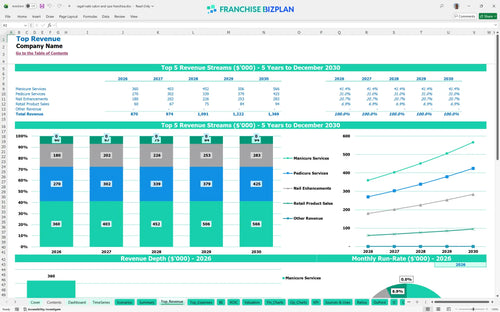
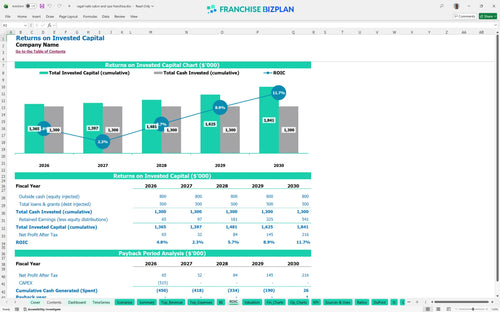
The model estimates an Internal Rate of Return (IRR) of 2.39% and a Return on Equity (ROE) of 0.68 over the initial period. With a five-year payback period, the investment relies on steady revenue growth from $870,000 in Year 1 to $1.36 million by Year 5 to drive long-term value.
The monthly break-even occurs in March 2026, driven by the need to cover $12,600 in core fixed costs including rent and utilities. Your ability to hit this target depends defintely on maintaining a high volume of pedicure and manicure services to offset the 6% royalty and 30% labor burden.
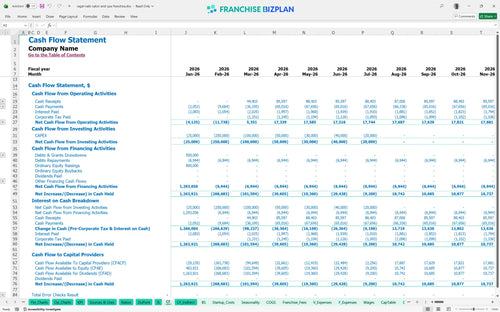
The lowest cash point is $796,000 in July 2026, which includes your initial working capital and opening reserves. You have a solid runway because the unit generates positive EBITDA within the first year, but you must monitor the gap between the January setup and the March revenue launch.
The High scenario assumes better technician productivity and higher retail sales, which can pull the payback period forward. In contrast, the Low scenario reflects a slower ramp-up in the Walmart corridor, which would increase the peak cash need and compress the Year 1 EBITDA margin below the $185,000 target.
This nail salon franchise financial model is built entirely in Excel, giving you total control over the numbers. You can swap out pre-filled assumptions for your specific territory or adjust the logic to test different growth paths. It is a flexible tool that handles the heavy lifting of math so you can focus on the strategy of opening your doors.

Planning for a single year is a start, but multi-unit success requires a five-year view. This model projects your revenue, expenses, and cash flow through 2030, showing how margins shift as your technicians gain speed and your local client base matures. It provides a clear look at the long-term value of the business beyond the initial ramp-up phase.

Franchise obligations can eat into your bottom line if you do not track them precisely. This tool automatically calculates the 6% royalty fees and initial $25,000 franchise fee, ensuring these costs are baked into your monthly cash flow. You will see exactly how much goes to the brand and how much stays in your pocket after every manicure and pedicure.

Knowing your total check size is critical before signing a lease. The model breaks down the $515,000 in primary capital expenditures, including leasehold improvements and equipment, against your expected revenue. It identifies the exact sales volume you need to hit each month to cover your $9,000 rent and fixed overhead.

Stop guessing if your labor costs are too high. The model includes built-in benchmarks for the nail salon industry, allowing you to compare your technician wages and supply costs against typical franchise standards. This helps you spot margin leaks early and adjust your staffing levels to match the 30,000+ weekly visitors at your anchor location.


Simply purchase and download the financial model template, then access it instantly using Microsoft Excel or Google Sheets. No installation or technical expertise required-just open and start working.

Enter your business-specific numbers, including revenue projections, costs, and investment details. The pre-built formulas will automatically calculate financial insights, saving you time and effort.

Leverage the investor-ready format to confidently showcase your financial projections to banks, franchise representatives, or investors. Impress stakeholders with clear, data-driven insights and professional reports.

Leverage the investor-ready format to confidently present your projections to banks, franchise representatives, or investors.