
All-in-one Dashboard
Core inputs and core outputs


This comprehensive toolkit provides a dynamic Excel-based franchise financial model designed to forecast every dollar from opening day through five years of operation.
Core inputs and core outputs
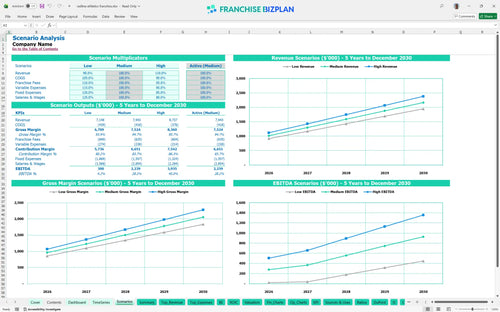
Three scenario analysis
Presentation ready
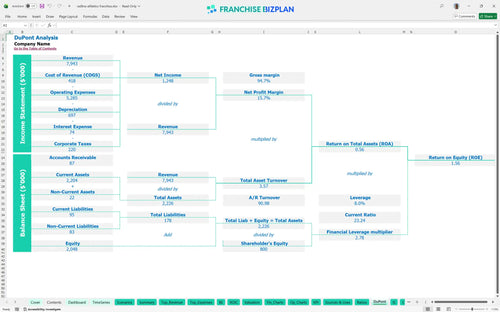
DuPont analysis
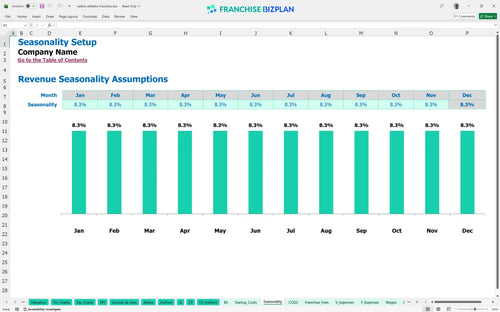
Researched revenue assumptions
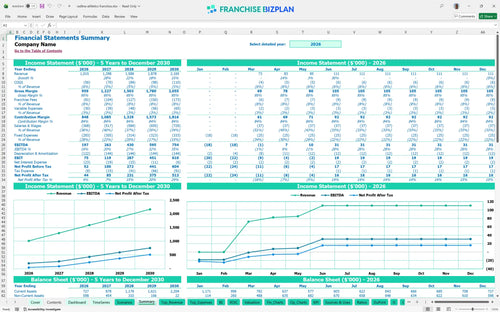
Lender-friendly financial outputs
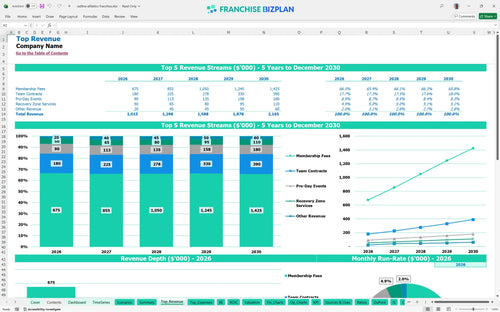
Revenue stream detailed view
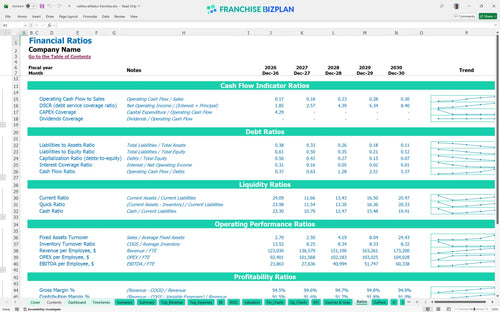
Performance metrics benchmark
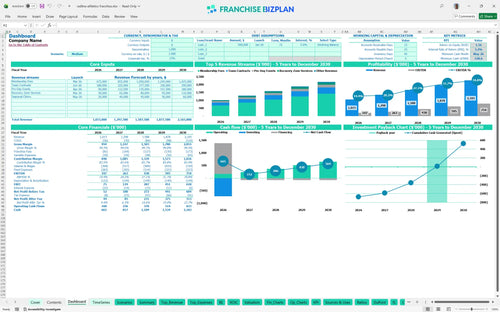
We built this franchise unit financial model using our own research into youth sports performance economics. Key assumptions like membership fees, $16,000 monthly rent, and a 7% royalty are pre-populated and fully editable. With Year 1 revenue projected at $1,015,000 and EBITDA at $197,000, this model gives you a data-driven starting point for your investment.
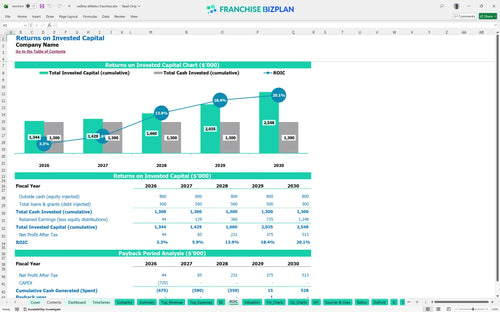
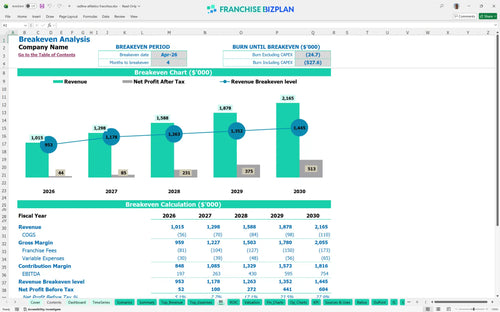
Based on the data, the unit reaches monthly break-even by April 2026, just four months after launching. Annual EBITDA grows from $197,000 in Year 1 to $754,000 by Year 5 as membership and team contracts scale.
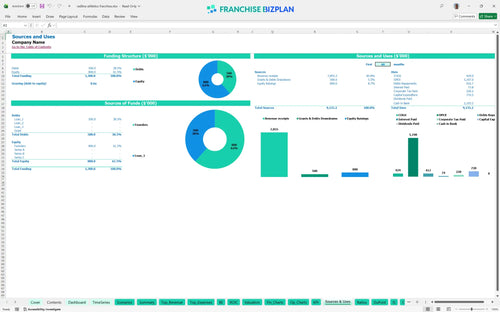
Launching this unit requires significant upfront capital, including a $49,500 franchise fee and $200,000 in leasehold improvements. The total initial investment covers everything from turf installation to a $80,000 cryotherapy chamber, with a minimum cash need of $529,000.
The model projects an Internal Rate of Return (IRR) of 3.15% and a Return on Equity (ROE) of 1.56. While the initial years focus on recovery, the payback period is estimated at 4 years, which is typical for high-CAPEX fitness facilities.
You need to hit break-even by April 2026 to stay on track. The biggest hurdle is the $16,000 monthly rent plus monthly salaries for your core team, so membership volume is defintely your most critical driver.
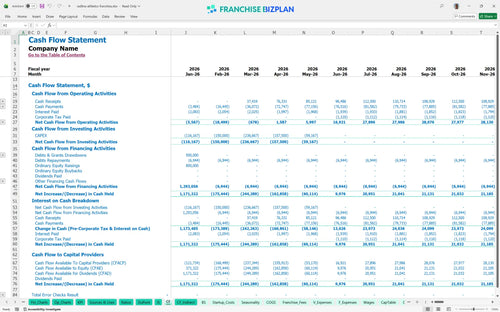
Your lowest cash point is projected at $529,000 in May 2026. You will need at least 6 months of operating liquidity to handle the ramp-up phase, especially since team contracts do not launch until June.
Shifting from a medium to a high-revenue scenario significantly shortens the payback period and boosts Year 1 EBITDA. If membership sales lag by 10%, your cash trough will deepen, requiring a larger working capital buffer to survive the first year.
Finance: update unit break-even and payback model by Friday.
This franchise unit financial model is fully customizable in Excel, featuring pre-filled formulas and editable assumptions. You can easily adjust variables for your specific territory, local rent, and staffing needs to see how different scenarios impact your bottom line.

Map out your long-term success with detailed 5-year projections for revenue, costs, and cash flow. This tool helps you visualize the transition from a single-unit startup to a mature, profitable sports performance center using a clear franchise business plan template.

The model tracks every franchise-specific obligation, from the initial $49,500 fee to ongoing 7% royalties and 1% marketing fund contributions. Understanding these off-the-top costs is vital for calculating your true store-level margin and franchise profitability analysis.

Estimate your total initial investment, including leasehold improvements and equipment, to determine your financial runway. The model identifies the exact sales volume needed to cover your fixed costs like the $16,000 monthly rent through a precise break-even analysis.

We have integrated industry benchmarks for labor and occupancy to help you sanity-check your numbers. Compare your projected performance against typical youth athletic training standards to ensure your gym franchise unit economics spreadsheet is realistic.


Simply purchase and download the financial model template, then access it instantly using Microsoft Excel or Google Sheets. No installation or technical expertise required-just open and start working.

Enter your business-specific numbers, including revenue projections, costs, and investment details. The pre-built formulas will automatically calculate financial insights, saving you time and effort.

Leverage the investor-ready format to confidently showcase your financial projections to banks, franchise representatives, or investors. Impress stakeholders with clear, data-driven insights and professional reports.

Leverage the investor-ready format to confidently present your projections to banks, franchise representatives, or investors.