
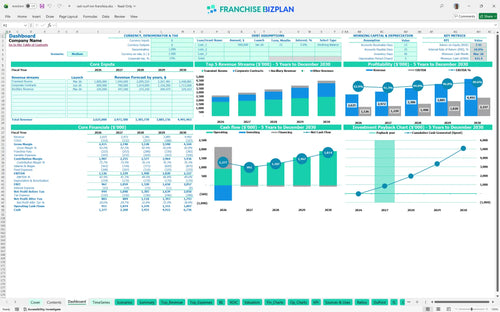
All-in-one Dashboard
Core inputs and core outputs


This comprehensive tool integrates revenue forecasting, staffing plans, and capital expenditure tracking into a single, investor-ready financial package.
Core inputs and core outputs
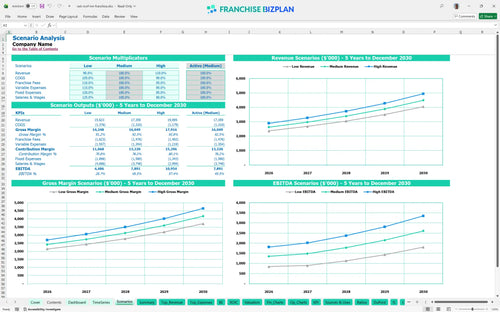
Three scenario analysis
Presentation ready
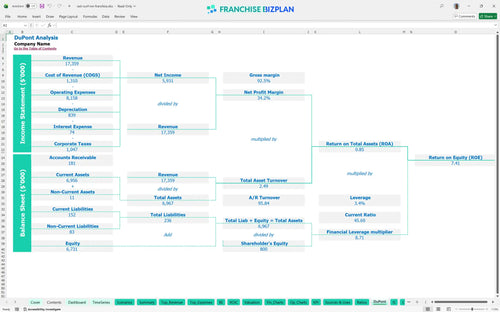
DuPont analysis
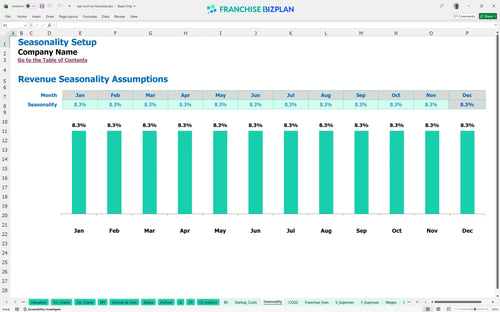
Researched revenue assumptions
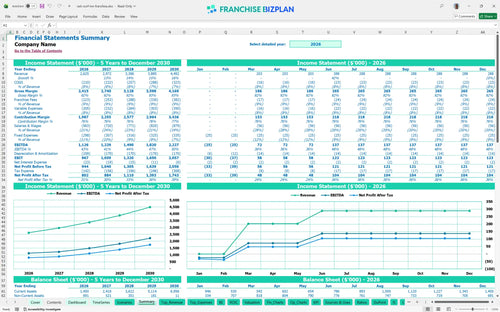
Lender-friendly financial outputs
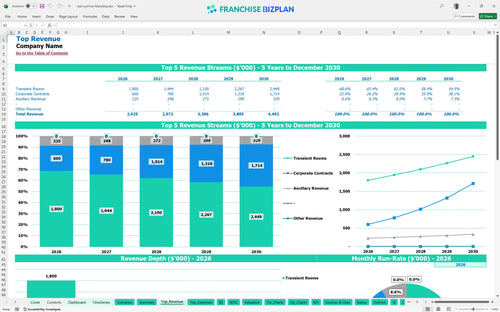
Revenue stream detailed view
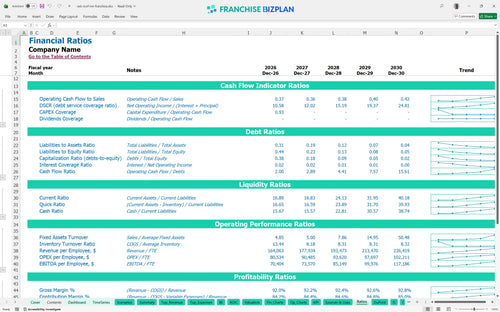
Performance metrics benchmark
We built this franchise unit financial model using detailed research on the economy lodging sector. Key assumptions, including $1.2 million in transient room revenue and a total 8.5% brand fee structure, are pre-populated and fully editable to fit your specific territory. This tool provides the data-driven clarity needed to move from a business plan to a signed franchise agreement.
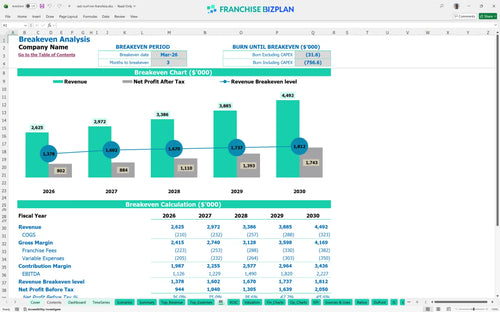
The unit reaches profitability in March 2026, just three months after launching. With year-one EBITDA projected at $1.12 million, the model shows a strong trajectory as corporate contracts ramp up in June 2026. Efficiency in the first 90 days is the key to hitting these numbers.
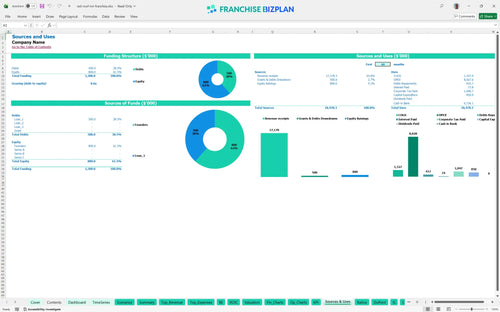
Launching this unit requires a total initial investment of $850,000 for capital expenditures plus a cash buffer. The largest outlays include $350,000 for leasehold improvements and $250,000 for guest room furnishings to meet brand standards. You will also need to cover the $30,000 franchise fee due in January 2026.
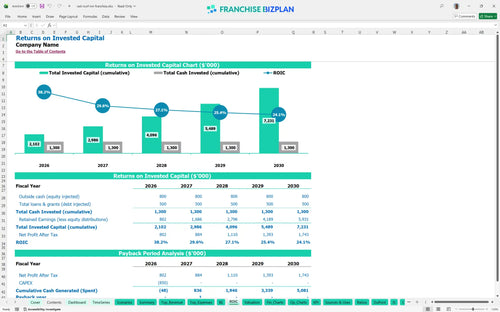
This investment offers a 9.97% Internal Rate of Return (IRR) and a 7.41% Return on Equity (ROE). The payback period is remarkably short at only 2 years, meaning you recover your initial capital quickly compared to other hospitality segments. Fast payback reduces your long-term risk significantly.
You hit the monthly break-even point in March 2026. This depends on maintaining high occupancy for transient rooms and managing the $15,000 monthly facility lease. Volume is your biggest lever, as the 8.5% brand fee and 6.0% booking commissions eat into every dollar of revenue.
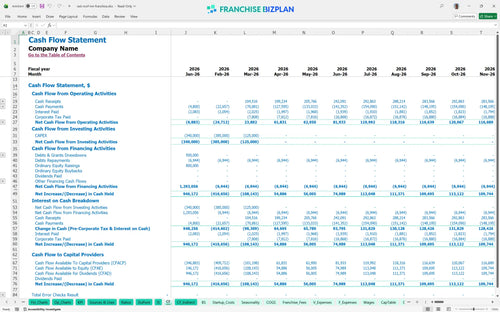
The lowest cash point occurs in March 2026 with $421,000 remaining in the bank. You defintely need to maintain this buffer to handle the timing gap between opening costs and the start of corporate contract revenue in June. Tight cash management during the first 120 days prevents emergency funding needs.
In a high-growth scenario, revenue climbs to $4.49 million by year five, doubling your annual EBITDA to $2.22 million. Low-case scenarios usually stem from poor occupancy or high labor costs, which can delay your 2-year payback. Execution at the local level determines whether you hit the high-margin projections.
Finance: update unit break-even and payback model by Friday
This hotel franchise financial model is a fully editable Excel tool designed for precision. It features pre-linked formulas and adjustable assumptions for occupancy, room rates, and labor, allowing you to simulate various economy lodging scenarios with ease. You can modify every driver to match your specific market conditions and site selection needs.

Plan for long-term success with a comprehensive hotel business plan spreadsheet that tracks performance through 2030. The model projects revenue scaling from $2.62 million in year one to over $4.49 million by year five, providing a clear view of store-level EBITDA and cash flow. This long-term perspective is vital for evaluating hospitality franchise investment opportunities and securing financing.

Manage your brand obligations accurately with built-in logic for a 4.5% royalty fee and a 4.0% marketing fund contribution. This franchise profitability analysis tool ensures you account for every dollar owed to the franchisor, including the initial $30,000 franchise fee. Understanding these fixed percentages helps you protect your store-level margin as you scale.

This hospitality startup cost template outlines the $850,000 required for physical assets, from leasehold improvements to front desk systems. It calculates the exact sales volume needed to cover your $15,000 monthly lease and other fixed costs. Knowing your floor helps you manage the ramp-up period without risking your liquidity.

Sanity-check your projections using built-in benchmarks for guest amenities and linen costs. The model assumes guest amenities run at 4.5% of revenue and laundry at 3.5%, helping you identify margin leaks early. These industry-standard figures ensure your franchise unit financial forecasting spreadsheet remains grounded in reality.


Simply purchase and download the financial model template, then access it instantly using Microsoft Excel or Google Sheets. No installation or technical expertise required-just open and start working.

Enter your business-specific numbers, including revenue projections, costs, and investment details. The pre-built formulas will automatically calculate financial insights, saving you time and effort.

Leverage the investor-ready format to confidently showcase your financial projections to banks, franchise representatives, or investors. Impress stakeholders with clear, data-driven insights and professional reports.

Leverage the investor-ready format to confidently present your projections to banks, franchise representatives, or investors.