
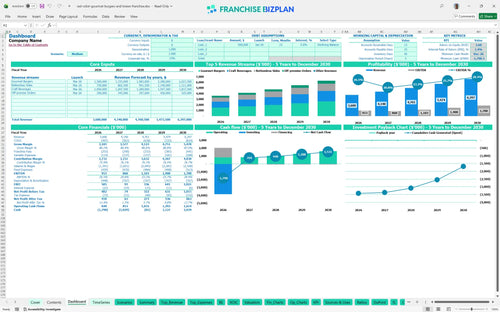
All-in-one Dashboard
Core inputs and core outputs


This franchise business plan Excel tool includes a full suite of pro forma statements, CAPEX schedules, and unit-level performance trackers designed for the casual dining sector.
Core inputs and core outputs
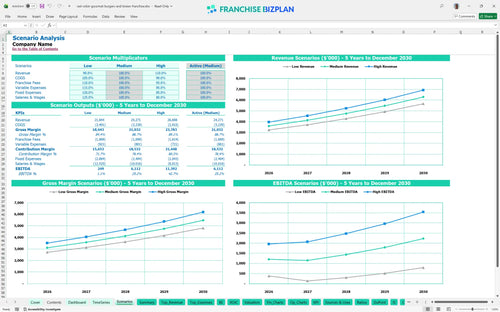
Three scenario analysis
Presentation ready
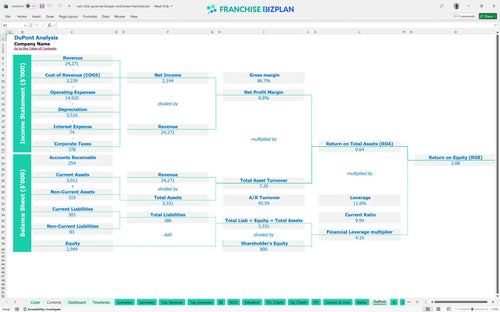
DuPont analysis
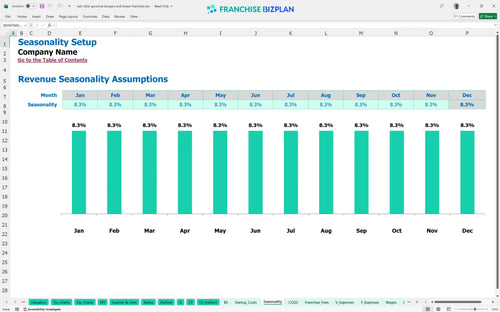
Researched revenue assumptions
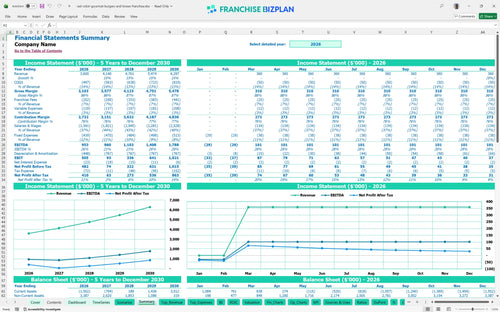
Lender-friendly financial outputs
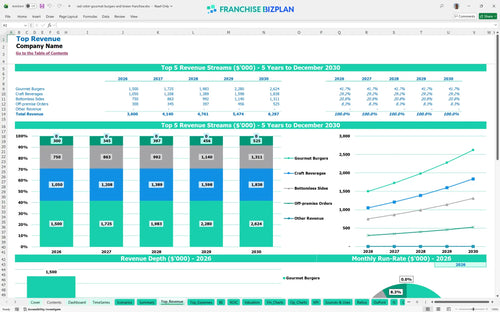
Revenue stream detailed view
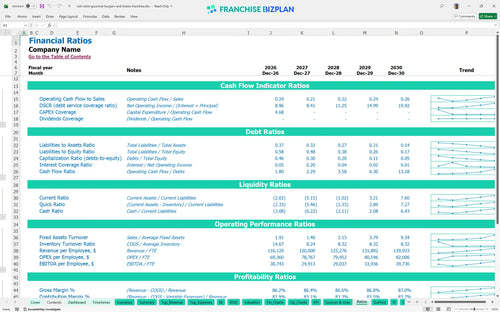
Performance metrics benchmark
We built this franchise unit financial model using our own research on the gourmet burger sector. Key assumptions, including the 4% royalty and $3.6M year-one revenue, are pre-populated with researched data and are fully editable to help you with evaluating franchise unit profitability and break-even analysis.
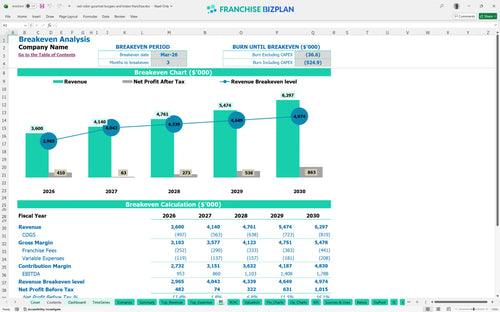
The model shows the unit reaches profitability in Year 1 with an EBITDA of $953,000. While the operational breakeven date is March 2026, the high initial investment means you are playing a long game for total capital recovery.
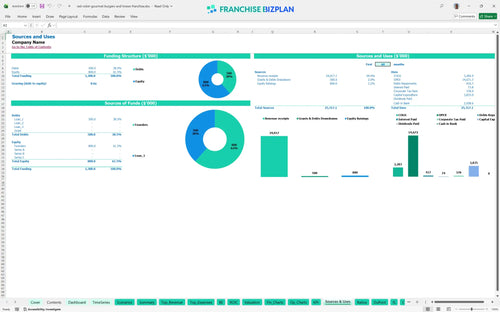
You will need significant liquidity to launch, with a total initial investment exceeding $3.8 million. This capital expenditure planning includes a $35,000 franchise fee and $2,000,000 for leasehold improvements to meet brand standards in a prime location.
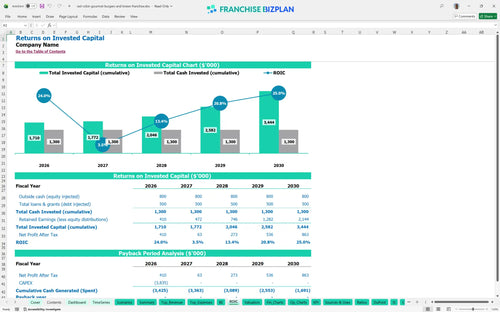
Analyzing return on investment for restaurant franchise units shows a 1.41% IRR and a 2.68% ROE. Given the high build-out costs, the payback period extends beyond the initial five-year window, making this a long-term equity play.
The unit is projected to hit its monthly break-even point in March 2026, just three months after launch. This unit economics analysis depends heavily on managing the monthly operational expense budget for burger franchise costs like the $25,000 rent.
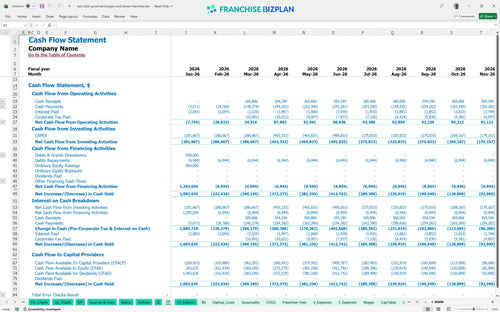
The lowest cash point occurs in December 2026 at -$1.798 million, reflecting the heavy upfront costs. You defintely need to know how to forecast cash flow for a multi-unit restaurant franchise to handle the timing gaps in your franchise cash flow statement.
Creating a financial projections model for a new franchise requires stress-testing. A 10% drop in Gourmet Burger sales significantly delays the payback, while the High case-driven by strong craft beverage margins-can boost Year 5 EBITDA toward $1.78M.
Estimating revenue and overhead for a gourmet burger restaurant is only useful if you act on the data. Use this franchise investment calculator to refine your territory-specific costs and secure your financing based on realistic cash flow projections.
Finance: update unit break-even and payback model by Friday.
This franchise financial model template is built in Excel to give you total control over your projections. You can adjust pre-filled formulas and editable assumptions to match your specific territory, whether you are looking at a single site or planning for a multi-unit rollout using this restaurant franchise financial forecasting Excel template.

Long-term planning is vital for a casual dining investment of this scale. This model provides a detailed 5-year outlook on revenue, operating expense projections, and cash flow, helping you see how unit economics evolve as the restaurant matures using best practices for franchise financial modeling and planning.

Managing the 4% royalty fee and 3% marketing fund contribution is built directly into the logic. By tracking these royalty fee structures against gross sales, you get a clear picture of your store-level EBITDA after all brand-mandated costs are paid.

Learning how to calculate startup costs for a casual dining franchise is the first step to avoiding a cash crunch. This tool maps out your restaurant franchise startup costs and identifies the exact sales volume needed to cover your $25,000 monthly rent and other fixed overhead.

We include restaurant profitability analysis benchmarks to ensure your labor and food costs stay within healthy ranges. Using this franchise business model financial spreadsheet for entrepreneurs, you can compare your $110,000 GM salary or 12% food ingredient cost against industry standards to spot margin leaks.


Simply purchase and download the financial model template, then access it instantly using Microsoft Excel or Google Sheets. No installation or technical expertise required-just open and start working.

Enter your business-specific numbers, including revenue projections, costs, and investment details. The pre-built formulas will automatically calculate financial insights, saving you time and effort.

Leverage the investor-ready format to confidently showcase your financial projections to banks, franchise representatives, or investors. Impress stakeholders with clear, data-driven insights and professional reports.

Leverage the investor-ready format to confidently present your projections to banks, franchise representatives, or investors.