
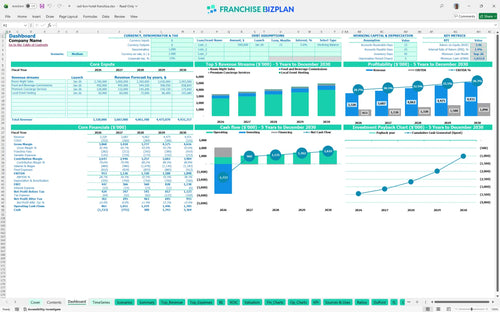
All-in-one Dashboard
Core inputs and core outputs


This franchise business plan Excel tool provides a complete hotel operational budget template including five-year pro forma statements and automated franchise fee calculations.
Core inputs and core outputs
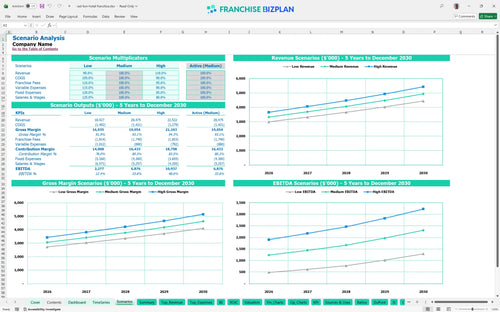
Three scenario analysis
Presentation ready
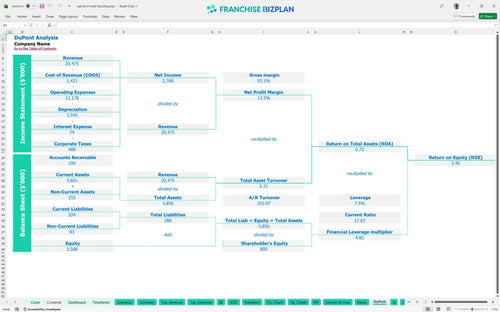
DuPont analysis
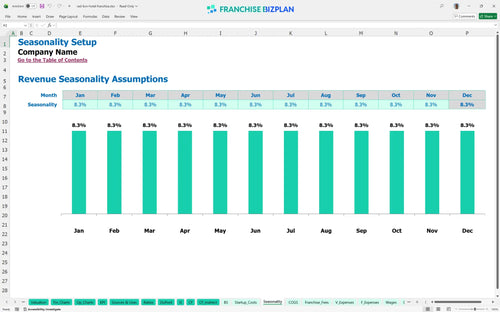
Researched revenue assumptions
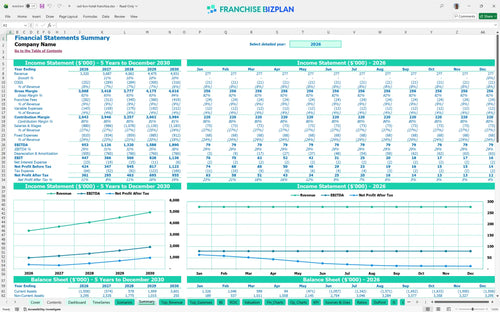
Lender-friendly financial outputs
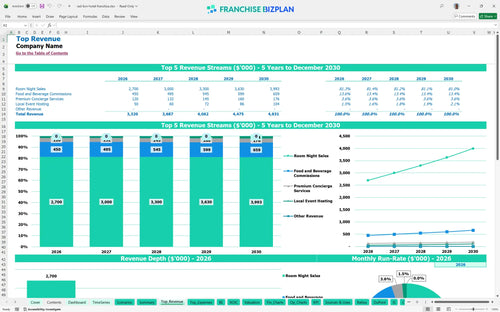
Revenue stream detailed view
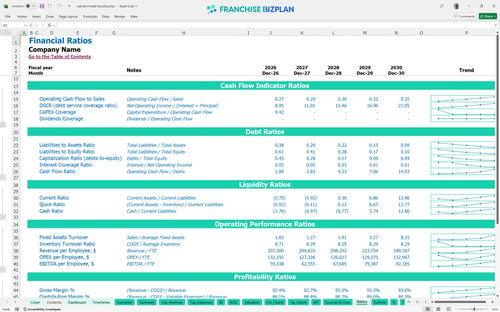
Performance metrics benchmark
We built this franchise unit financial model using our own research to provide a realistic roadmap for midscale hospitality operators. Key assumptions, including estimating revenue from hotel ancillary services and managing a $3,320,000 Year 1 revenue target, are pre-populated and fully editable to match your specific territory. This tool ensures you account for every dollar, from the $75,000 initial franchise fee to the $1,890,000 Year 5 EBITDA projection.
This hotel franchise unit becomes operationally profitable in its first year, generating a $953,000 EBITDA. You will defintely need to manage the 4.8% housekeeping supply cost and the combined 8.5% franchise fees to maintain this trajectory as you scale to $4,931,000 in annual revenue by year five.
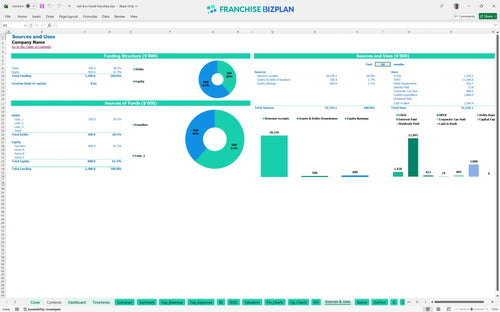
Launching this unit requires approximately $3.8 million in total capital to cover the $1,200,000 in leasehold improvements and $1,000,000 for guest room renovations. Your capital expenditure forecasting must also account for the $1,822,000 cash dip expected during the ramp-up phase before room night revenue stabilizes.
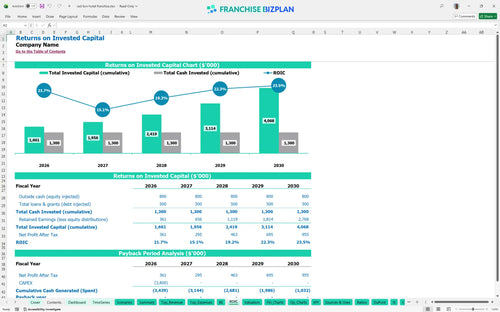
Investors can expect an Internal Rate of Return (IRR) of 1.89% and a Return on Equity (ROE) of 3.46% over the initial five-year period. Calculating return on investment for hotel real estate is a long game here, as the high $3.8M initial cost means the full payback period extends beyond the fifth year of operation.
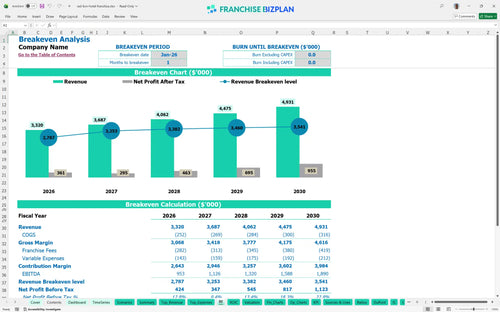
The monthly break-even point is reached in January 2026, assuming you hit your $3.32M annual revenue target. The primary driver for break-even is the $40,000 monthly property lease rent, which requires consistent occupancy and hospitality revenue management to cover the fixed overhead and 1.3% processing fees.
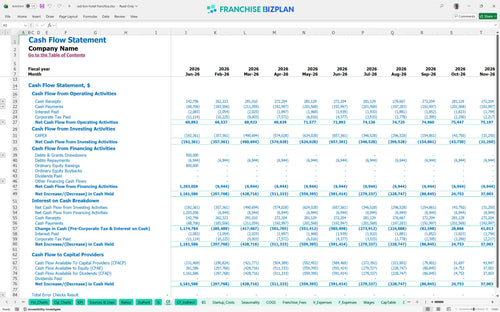
The lowest cash point occurs in September 2026 with a $1,822,000 deficit during the peak of renovation and pre-opening activities. You need roughly nine months of runway to bridge the gap between the $75,000 franchise fee payment and stabilized room revenue from tech professional bookings.
Moving to a high-growth scenario improves the 1.89% IRR by spreading the $140,000 General Manager salary across a larger revenue base. This financial model for boutique hotel conversion or midscale builds shows that hitting the $2,662,000 room revenue target by year five is the key to maximizing your long-term equity value.
This Excel template for midscale hotel financial forecasting allows you to adjust every variable to fit your specific market. The hotel franchise financial model features pre-filled formulas and editable assumptions for room rates, occupancy, and labor, making it easy to build a custom scenario for your location.

Plan for long-term growth with a detailed hotel profit and loss statement that spans sixty months of operation. This tool generates pro forma financial statements for hotel franchise owners, helping you visualize how room night sales and food commissions scale from year one through year five.

This hotel franchise profitability analysis spreadsheet automatically calculates your 5% royalty and 3.5% marketing fund obligations. By integrating the franchise royalty fee calculation into your monthly overhead, you can see exactly how brand costs impact your store-level EBITDA and net cash flow.

Use this hotel startup cost template to estimate your total initial investment, from the $75,000 franchise fee to the $1,200,000 leasehold budget. You will learn how to calculate hotel franchise startup costs accurately so you can identify the exact occupancy volume needed to cover your $40,000 monthly rent.

The model includes a hotel operational cost breakdown template with built-in benchmarks for labor and housekeeping supplies. These best practices for hotel franchise financial planning help you sanity-check your occupancy rate projections against industry standards to ensure your margins remain realistic and competitive.


Simply purchase and download the financial model template, then access it instantly using Microsoft Excel or Google Sheets. No installation or technical expertise required-just open and start working.

Enter your business-specific numbers, including revenue projections, costs, and investment details. The pre-built formulas will automatically calculate financial insights, saving you time and effort.

Leverage the investor-ready format to confidently showcase your financial projections to banks, franchise representatives, or investors. Impress stakeholders with clear, data-driven insights and professional reports.

Leverage the investor-ready format to confidently present your projections to banks, franchise representatives, or investors.