
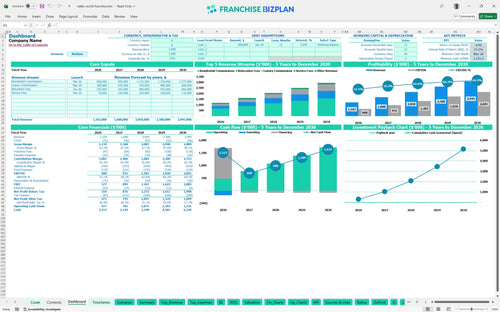
All-in-one Dashboard
Core inputs and core outputs


This comprehensive Excel financial model for new real estate brokerage includes everything from revenue stream forecasting to detailed capital expenditure budgets for a turnkey planning experience.
Core inputs and core outputs
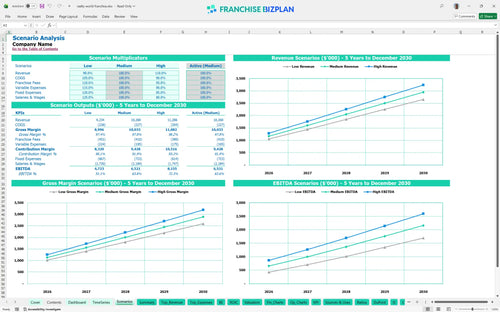
Three scenario analysis
Presentation ready
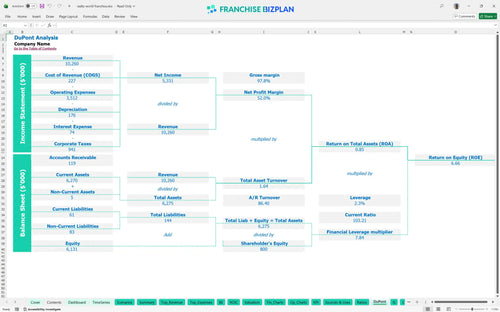
DuPont analysis
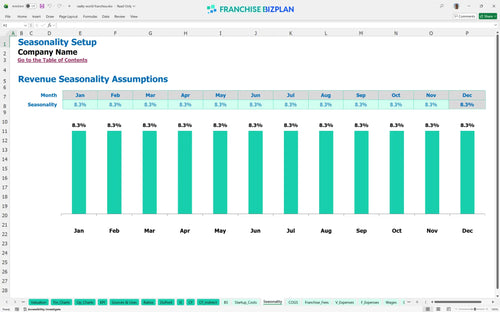
Researched revenue assumptions
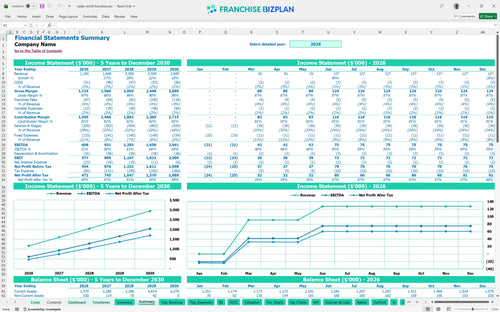
Lender-friendly financial outputs
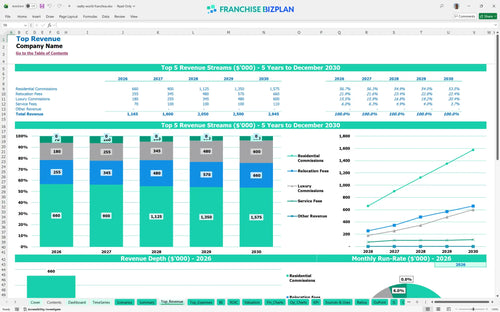
Revenue stream detailed view
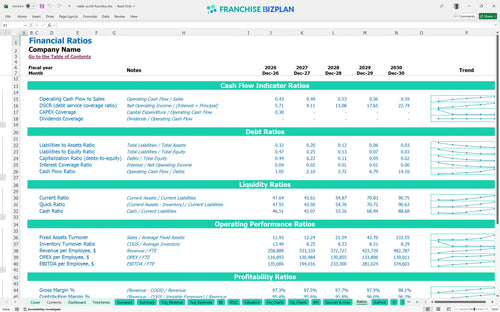
Performance metrics benchmark
We developed this real estate franchise unit profit and loss template using extensive market research to ensure every line item reflects actual brokerage operations. The model comes pre-populated with data like a $1.16 million year-one revenue target and specific $18,000 VR tour equipment costs, all of which you can edit. This is a practical roadmap designed to help you move from a business idea to a fully operational office with confidence.
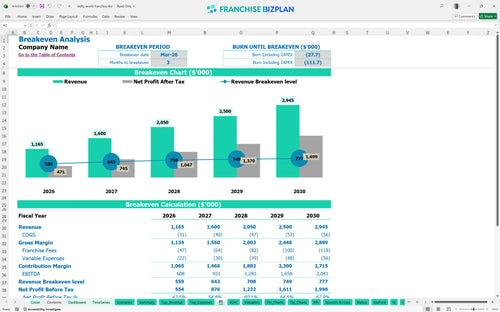
The unit is projected to reach profitability in March 2026, just three months after launching. This quick turnaround assumes you hit your initial residential commission targets and manage the 4% combined royalty and marketing burden effectively. Speed to profit is the ultimate metric for any new operator.
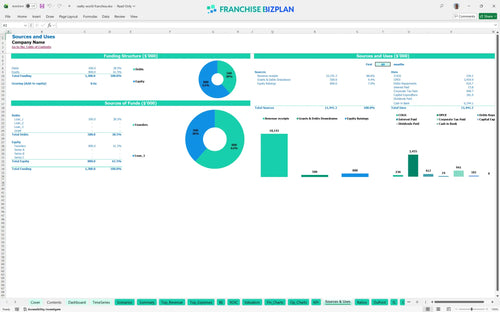
You will need significant capital to launch this real estate office, with a total initial investment covering the $18,000 franchise fee and $60,000 for office improvements. The model accounts for a minimum cash requirement of $1.125 million to handle the ramp-up and initial staffing of five key roles. Capital is the fuel that powers your market entry.
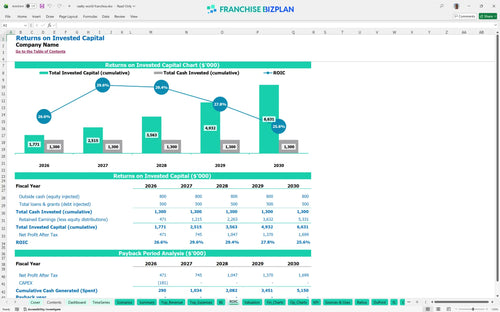
This real estate franchise business financial feasibility study shows an Internal Rate of Return (IRR) of 23.1% and a Return on Equity (ROE) of 6.66. While the unit breaks even monthly very quickly, the full payback of the initial investment occurs after year five due to the high initial capital outlays. Patience in the first few years pays off in long-term equity.
The monthly break-even point occurs in March 2026, driven primarily by the launch of residential and luxury commission streams. Your ability to cover the $7,000 monthly rent and $28,750 in monthly base salaries for the core team is the most critical hurdle. Revenue covers costs once your agent pipeline matures. Volume solves almost every brokerage problem.
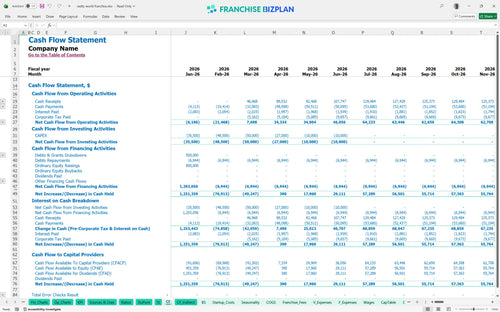
The lowest cash point is projected at $1.125 million in March 2026, coinciding with the end of the initial build-out and the start of full operations. You should maintain a three-month operating buffer to protect against seasonal dips in the Austin real estate market. Cash is your only defense against an unexpected market shift.
The model allows you to test how a 10% drop in residential commissions or a spike in agent turnover affects your year-one EBITDA of $608,000. High-performance scenarios show EBITDA climbing to over $2 million by year five if you dominate the luxury and relocation segments. Planning for the worst helps you achieve the best. Precision in your assumptions leads to confidence in your execution.
This franchise financial model template is built entirely in Excel, giving you full control over every assumption and calculation. You can easily adjust pre-filled formulas to match your specific territory, local market density, and planned office footprint without needing a degree in finance. It is a plug-and-play real estate franchise business plan tool that adapts as your brokerage grows. Every cell is open, so you can defintely customize the logic to fit your unique vision.

Planning for a real estate brokerage financial forecast requires a long-term view of agent productivity and market cycles. This model provides a detailed 5-year outlook on revenue, expenses, and cash flow to help you navigate the transition from a startup office to a market leader. You will see exactly how scaling your agent count impacts the bottom line over sixty months. Long-term clarity is the best cure for short-term anxiety.

Operating a branded brokerage means managing specific financial obligations like royalties and marketing fund contributions. This model tracks the 3% royalty fee and 1% marketing fee against your gross commission income to show your true store-level margin. It simplifies franchise profitability analysis by automating these calculations based on your monthly sales volume. Knowing your 'net-net' is vital before you sign a long-term lease.

This tool serves as a comprehensive franchise ROI calculator by mapping out your total franchise unit startup costs. You can estimate the total initial investment, including the $18,000 franchise fee and $60,000 in leasehold improvements, to determine your exact funding requirement. It identifies the specific sales volume needed to cover your $7,000 monthly rent and other fixed overhead. Margin protection starts with knowing your fixed-cost floor.

We integrated industry-standard metrics to help you sanity-check your real estate brokerage financial forecast against typical performance ranges. The model allows you to compare your projected labor costs, such as the $120,000 managing broker salary, against sector averages to ensure your plan is realistic. Use these benchmarks to spot potential margin leaks before they hit your bank account. Real-world data keeps your projections grounded in reality.


Simply purchase and download the financial model template, then access it instantly using Microsoft Excel or Google Sheets. No installation or technical expertise required-just open and start working.

Enter your business-specific numbers, including revenue projections, costs, and investment details. The pre-built formulas will automatically calculate financial insights, saving you time and effort.

Leverage the investor-ready format to confidently showcase your financial projections to banks, franchise representatives, or investors. Impress stakeholders with clear, data-driven insights and professional reports.

Leverage the investor-ready format to confidently present your projections to banks, franchise representatives, or investors.