
All-in-one Dashboard
Core inputs and core outputs


This comprehensive template includes detailed schedules for agent dues, transaction fees, luxury commissions, and a full five-year outlook on EBITDA and cash flow.
Core inputs and core outputs
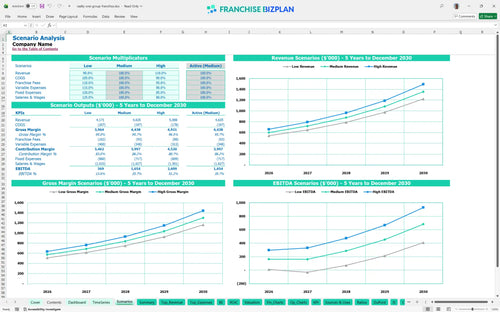
Three scenario analysis
Presentation ready
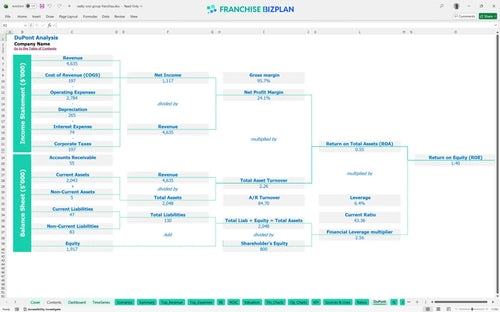
DuPont analysis
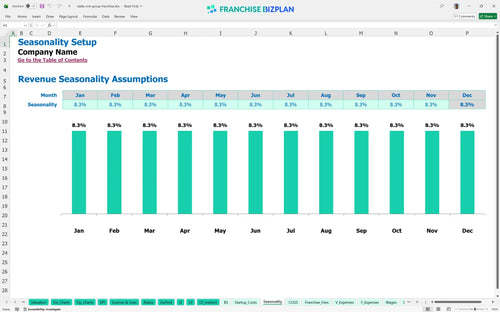
Researched revenue assumptions
Lender-friendly financial outputs
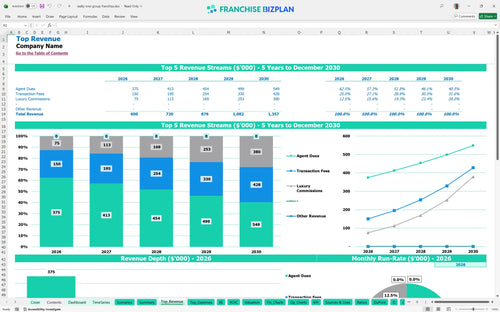
Revenue stream detailed view
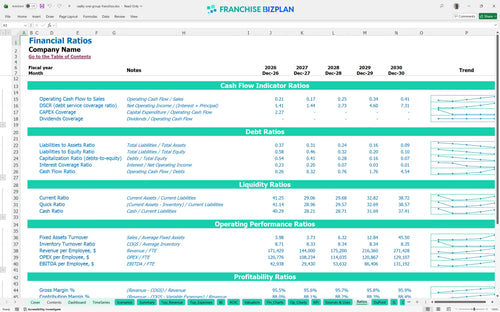
Performance metrics benchmark
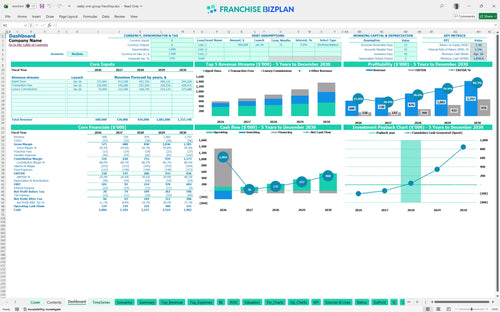
We built this real estate franchise business plan and financial model for 100% commission real estate brokerage using our own research. Key assumptions like the $250,000 year-one agent dues and $150,000 initial EBITDA are pre-populated and fully editable. This franchise profitability analysis helps you map out the path from launch to a mature $656,000 annual profit by year five.
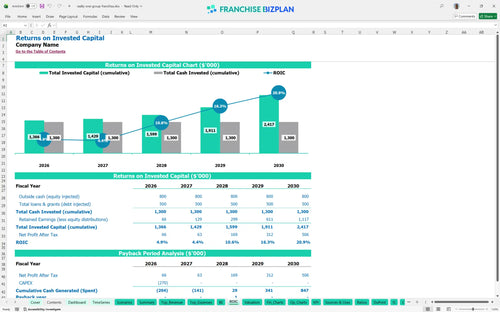
This franchise unit profitability spreadsheet shows the unit becomes profitable in year one, with a break-even date of January 2026. Net profit grows as luxury commissions scale from $50,000 to $253,125 by the fifth year of operation.
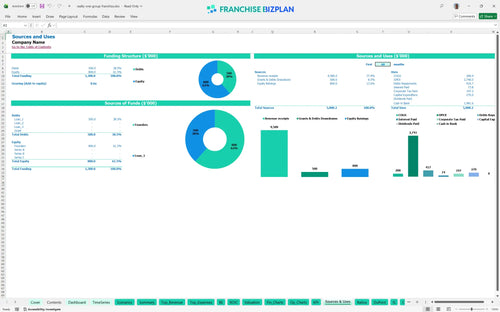
Startup capital requirements for real estate franchise operations total $270,000 for initial CAPEX plus a significant cash buffer. The $100,000 office build-out and $60,000 technology suite represent the largest portions of the initial cash outlay.
Franchise investment ROI is calculated at an internal rate of return (IRR) of 5.54% and a return on equity (ROE) of 1.4. The payback period is 3 years, which is defintely achievable for a high-visibility flagship location in a prime market.
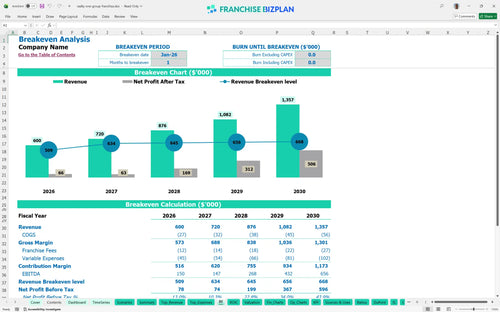
Estimating monthly overhead for real estate office units is critical, as the $7,500 rent and $85,000 broker salary set a high fixed floor. You reach break-even in just 1 month by focusing on high-volume agent dues and transaction fees.
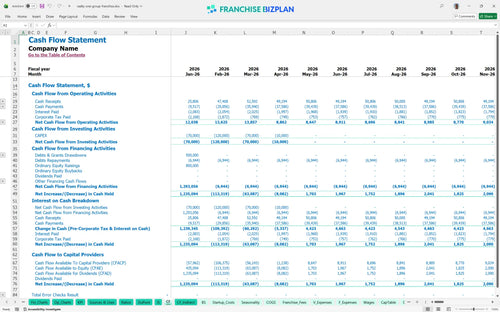
The real estate franchise operating budget template identifies April 2026 as the lowest cash point at $1,051,000. You need a robust runway to handle the gap between the $270,000 build-out and the ramp-up of recurring real estate brokerage revenue streams.
Financial planning for new real estate brokerage requires comparing scenarios; a high-growth case for forecasting revenue for luxury real estate office sales can double your year-5 EBITDA. The model shows how a 10% shift in agent retention impacts peak cash needs and overall unit profitability.
This franchise financial model template is a fully customizable Excel tool designed for real estate operators. It features pre-filled formulas and editable assumptions that make it easy to adapt to your specific territory, agent count, and local market conditions. Using this Excel template for franchise financial projections allows you to swap out default values for your own data to see immediate impacts on your bottom line.

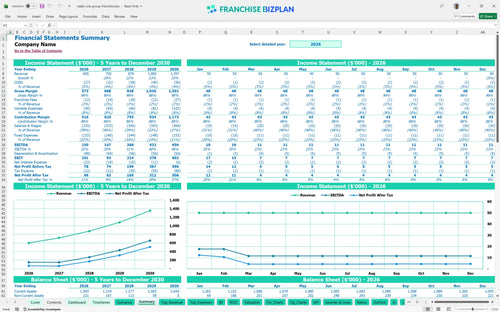
Long-term planning is essential for a real estate brokerage financial forecast. This model provides detailed 5-year revenue, cost, cash flow, and profit projections tailored for a single unit or a multi-office expansion. It maps the transition from a $600,000 year-one revenue base to a mature $1.35 million operation, helping you visualize the scaling process and long-term equity growth.

Analyzing franchise revenue and transaction fees requires a clear view of your obligations to the franchisor. This model captures the $20,000 initial fee and the 2% marketing fund contribution, while accounting for the 0% royalty structure typical of this brand. This level of detail is vital for a thorough franchise disclosure document analysis and understanding your true store-level margin.

Estimating your franchise unit startup costs is the first step toward a successful launch. This tool helps you calculate total investment needs, including the $100,000 leasehold improvement budget and $60,000 technology suite. By knowing how to calculate startup costs for a real estate franchise accurately, you can ensure you have enough capital to reach your break-even point without mid-ramp funding gaps.

This model incorporates built-in benchmarks for operating expenses for real estate office management, such as the $7,500 monthly rent and $85,000 managing broker salary. These figures allow you to sanity-check your assumptions against industry standards for high-traffic brokerage hubs. Comparing your projected gross margins and labor spend against these benchmarks helps ensure your unit remains competitive and profitable.


Simply purchase and download the financial model template, then access it instantly using Microsoft Excel or Google Sheets. No installation or technical expertise required-just open and start working.

Enter your business-specific numbers, including revenue projections, costs, and investment details. The pre-built formulas will automatically calculate financial insights, saving you time and effort.

Leverage the investor-ready format to confidently showcase your financial projections to banks, franchise representatives, or investors. Impress stakeholders with clear, data-driven insights and professional reports.

Leverage the investor-ready format to confidently present your projections to banks, franchise representatives, or investors.