
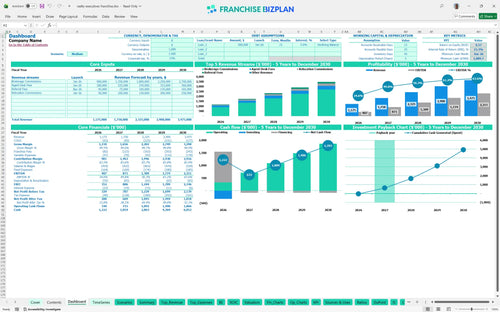
All-in-one Dashboard
Core inputs and core outputs


This comprehensive financial toolkit provides a dynamic 5-year outlook, automated royalty tracking, and detailed startup cost breakdowns to help you master your brokerage economics.
Core inputs and core outputs
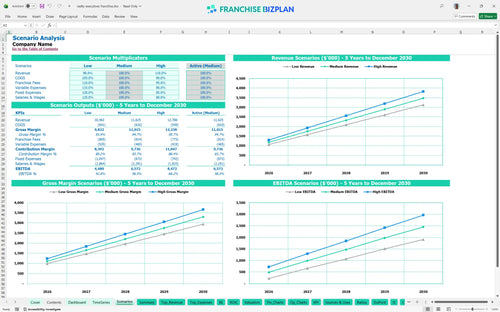
Three scenario analysis
Presentation ready
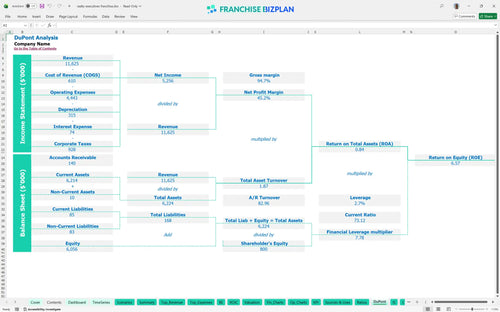
DuPont analysis
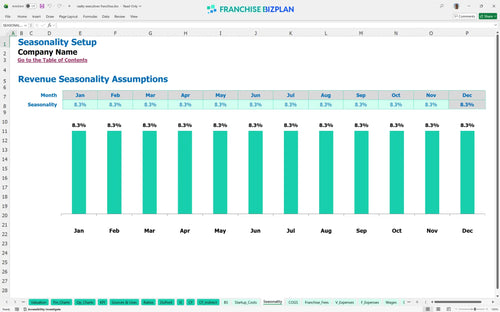
Researched revenue assumptions
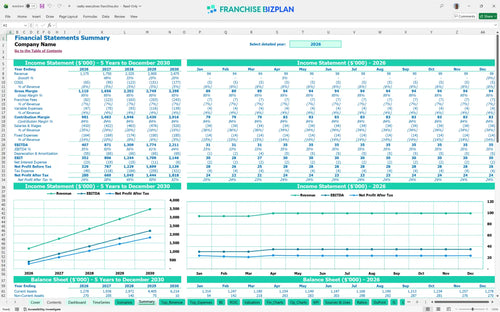
Lender-friendly financial outputs
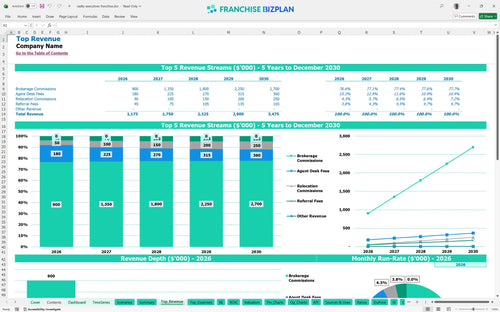
Revenue stream detailed view
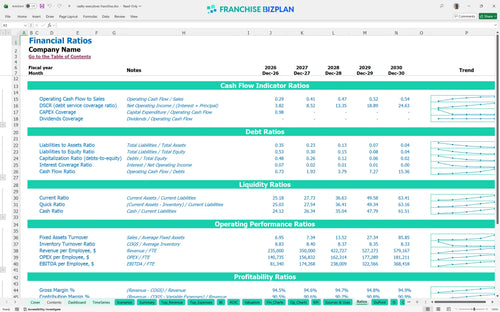
Performance metrics benchmark
We developed this model using detailed franchise disclosure document financial analysis and market research to ensure the inputs reflect real-world brokerage operations. The pre-populated data includes a year-one revenue target of $1,175,000 and an EBITDA of $407,000, all of which you can edit to match your specific location and agent recruitment goals.
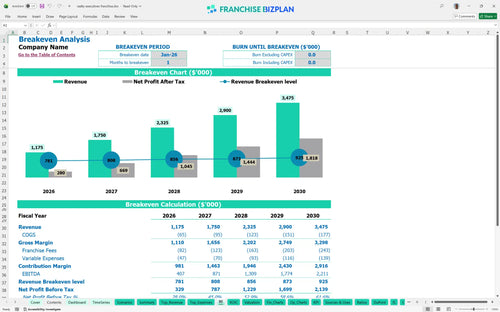
Your brokerage hits the profit mark almost immediately, with a breakeven date of January 2026. This rapid transition is driven by high-margin brokerage commissions and a structured real estate brokerage P&L statement that keeps transaction costs around 4.5% while managing a real estate commission split structure that favors top producers.
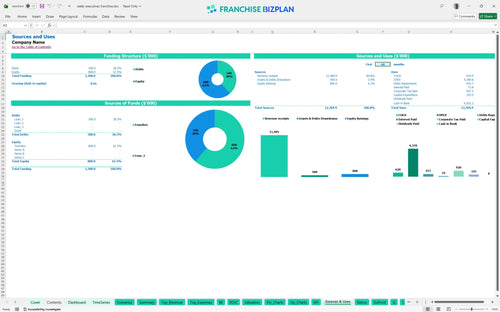
Knowing how to calculate startup costs for a real estate franchise is vital when you are looking at a $325,000 initial outlay. This includes a $30,000 franchise fee and $150,000 for leasehold improvements, all part of a comprehensive real estate office operational budget designed for a high-traffic, upscale district.
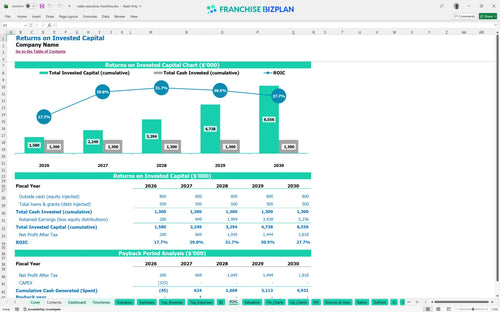
This real estate franchise investment return analysis shows a strong 15.3% internal rate of return and a 6.57 return on equity. With a 2-year payback period, investors can use this as a franchise ROI calculator to see how the $407,000 first-year EBITDA scales as the office matures.
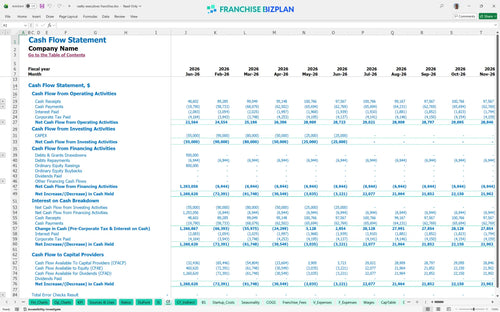
The model shows you reach breakeven in just one month, provided you hit your initial commission targets. Using this real estate agency cash flow forecasting template, you can see that the $10,000 monthly rent and $28,750 salary load are the primary fixed hurdles you must clear through consistent transaction volume.
Financial planning for independent real estate brokerage owners requires watching the lowest cash point, which occurs in June 2026 at $1,090,000. This suggests you need a solid capital base to handle the initial build-out and the six-month ramp-up before the cash flow becomes self-sustaining.
A boutique real estate brokerage business model analysis shows that even small shifts in commission volume significantly impact your year-one $407,000 EBITDA. High-performance scenarios focus on calculating commission splits for top-producing real estate agents to maximize the $1.8 million in annual commissions projected by year five.
This real estate franchise financial model is built in Excel for maximum flexibility, allowing you to swap out core assumptions as your market shifts. You can adjust every formula and driver, from agent count to transaction volume, making it a defintely reliable real estate franchise financial model Excel template for any territory.

Planning for the long haul requires more than just a gut feeling; you need a detailed franchise financial projection template to see the path from year one to year five. This model tracks your climb from $1.175 million in initial revenue to a mature $3.475 million operation, providing clear financial projections for a new real estate brokerage.

Managing the financial relationship with your franchisor is critical for maintaining store-level margins. This real estate franchise royalty fee and expense calculator handles the 6% royalty and 1% marketing fund contributions automatically, so you always know exactly how much of your $600,000 in annual brokerage commissions stays in your pocket.

Understanding real estate brokerage startup costs is the first step toward a successful launch. With a total initial CAPEX of $325,000 covering everything from leaseholds to AI software, this model helps you visualize the cost of opening a high-end real estate office and identifies the exact moment you stop burning cash.

We have integrated real estate agency profitability analysis tools to help you compare your projected performance against industry standards. By tracking fixed costs like the $10,000 monthly premium rent and $28,750 in monthly base wages, you can ensure your unit remains competitive and efficient from day one.


Simply purchase and download the financial model template, then access it instantly using Microsoft Excel or Google Sheets. No installation or technical expertise required-just open and start working.

Enter your business-specific numbers, including revenue projections, costs, and investment details. The pre-built formulas will automatically calculate financial insights, saving you time and effort.

Leverage the investor-ready format to confidently showcase your financial projections to banks, franchise representatives, or investors. Impress stakeholders with clear, data-driven insights and professional reports.

Leverage the investor-ready format to confidently present your projections to banks, franchise representatives, or investors.