
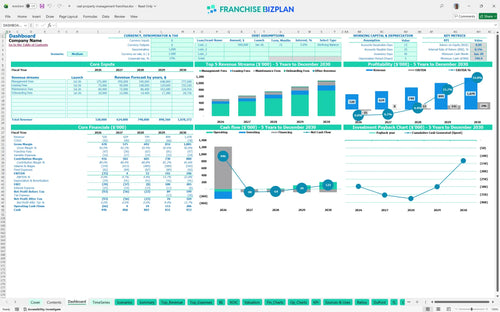
All-in-one Dashboard
Core inputs and core outputs


This template provides a complete financial modeling for rental property management including dynamic revenue drivers, CAPEX tracking, and automated 5-year financial statements.
Core inputs and core outputs
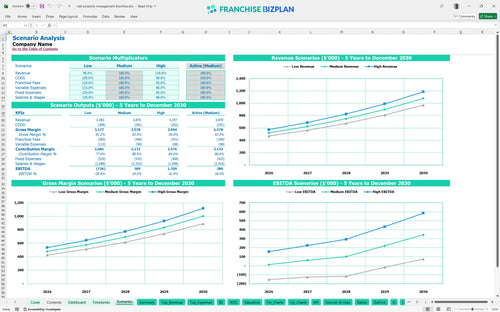
Three scenario analysis
Presentation ready
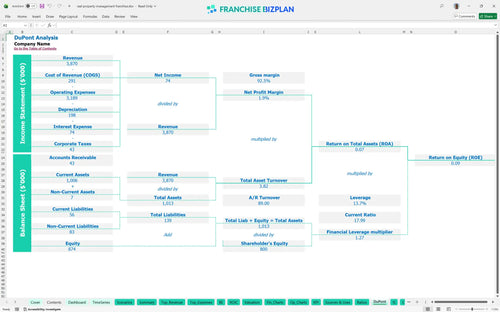
DuPont analysis
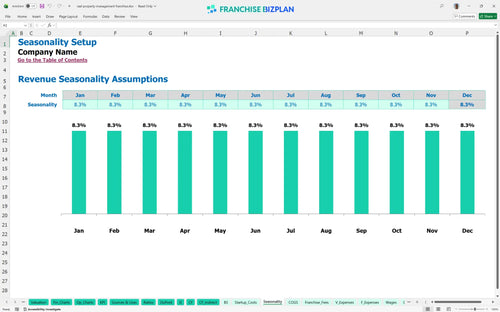
Researched revenue assumptions
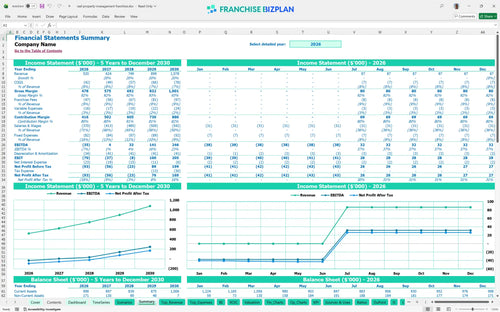
Lender-friendly financial outputs
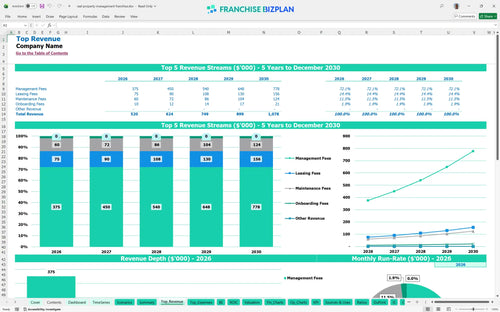
Revenue stream detailed view
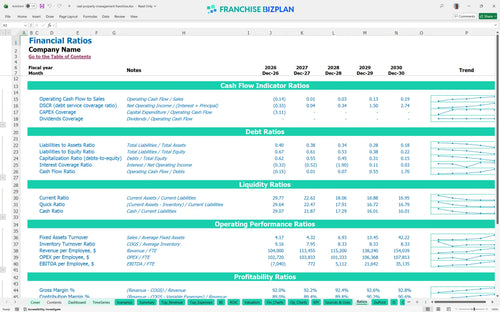
Performance metrics benchmark
We built this property management franchise financial template excel using researched data for revenue streams like management and leasing fees. Key assumptions, including the $4,500 monthly rent and $520,000 year-one revenue target, are pre-populated and fully editable to match your specific business plan. This model provides a clear look at how a $35,000 year-one EBITDA loss transforms into a $246,000 profit by year five.
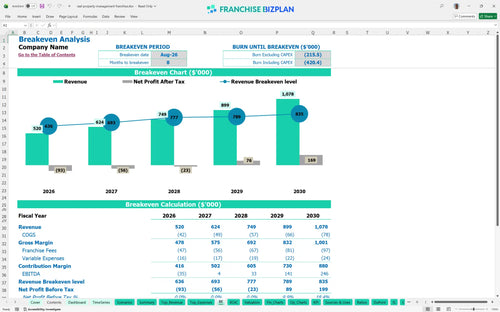
The franchise unit defintely reaches profitability in Year 2, posting a positive EBITDA of $4,000. While Year 1 sees a $35,000 loss during the ramp-up phase, the scaling management fees eventually cover the fixed payroll and $4,500 monthly rent.
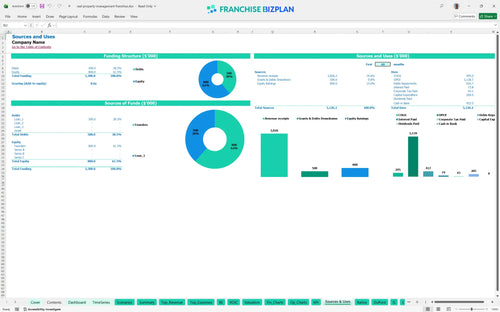
You need approximately $204,900 to launch this franchise unit in the US. This total includes the $59,900 franchise fee, $60,000 for office leasehold improvements, and $20,000 for the initial tech setup and computer systems.
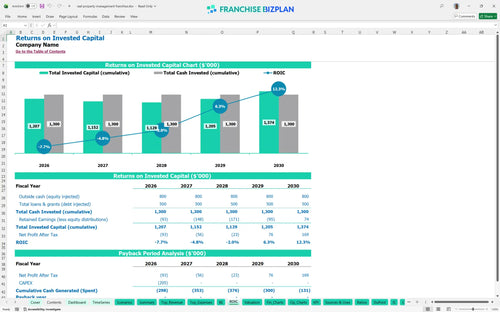
Investors can expect a 48% Internal Rate of Return (IRR) and a 9% Return on Equity (ROE) over the five-year period. While the full payback occurs after Year 5, the steady climb to a $246,000 annual EBITDA shows strong long-term value. Use this ROI calculation to evaluate your entry into the market.
The unit hits its monthly break-even point in August 2026, just 8 months after the initial launch. The primary driver for reaching this milestone is the recurring management fee revenue, which must scale quickly to offset the $26,666 monthly fixed salary burden.
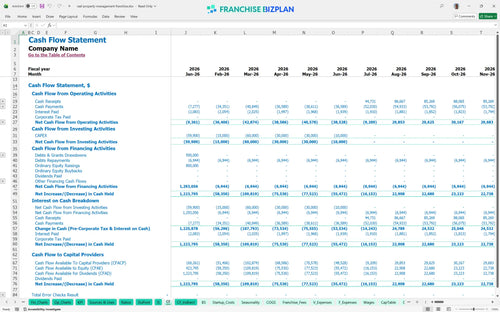
The lowest cash point occurs in January 2029 at $800,000, indicating that significant working capital is required to sustain operations during the growth years. This property management franchise operating budget template helps you monitor the gap between your $204,900 startup spend and mature-unit cash flow.
A High scenario can significantly pull forward the 8-month break-even by maximizing the $103,680 year-five leasing fee potential. This property management franchise profitability spreadsheet shows that even small dips in management fee volume in a Low scenario will delay profitability timing and increase peak cash needs.
This franchise financial model is built in Excel with open formulas and editable assumptions, allowing you to adjust management fee percentages or leasing volumes to fit your specific territory. You can modify every driver to see how local market shifts impact your bottom line in this business financial spreadsheet.

Plan your growth with detailed revenue projections that scale from $520,000 in year one to over $1,078,000 by year five. This long-term view helps you anticipate when to add leasing specialists or administrative support as your portfolio of managed properties expands.

The model automatically calculates the 7% royalty and 2% marketing fund contributions based on your gross revenue streams. This property management franchise investment guide includes the $59,900 initial fee, ensuring you account for all brand-related financial obligations from day one.

Estimate your total property management startup costs, including the $204,900 required for office improvements, tech setup, and initial marketing. The tool identifies the exact revenue level needed to cover your $4,500 monthly rent and professional staffing costs.

We incorporated franchise unit economics to help you sanity-check your operational expenses, such as the $100,000 principal broker salary. Use these benchmarks to compare your projected store-level margins against typical industry performance for residential property management.


Simply purchase and download the financial model template, then access it instantly using Microsoft Excel or Google Sheets. No installation or technical expertise required-just open and start working.

Enter your business-specific numbers, including revenue projections, costs, and investment details. The pre-built formulas will automatically calculate financial insights, saving you time and effort.

Leverage the investor-ready format to confidently showcase your financial projections to banks, franchise representatives, or investors. Impress stakeholders with clear, data-driven insights and professional reports.

Leverage the investor-ready format to confidently present your projections to banks, franchise representatives, or investors.