
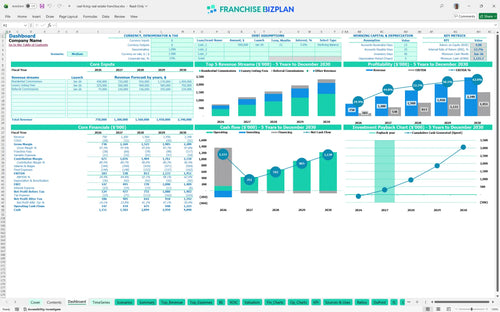
All-in-one Dashboard
Core inputs and core outputs


This financial projection spreadsheet for franchises provides a detailed, five-year roadmap for managing a premium real estate brokerage from launch to maturity.
Core inputs and core outputs
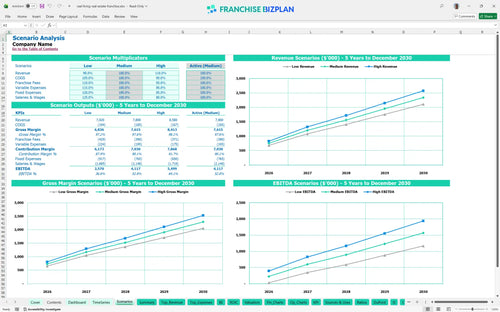
Three scenario analysis
Presentation ready
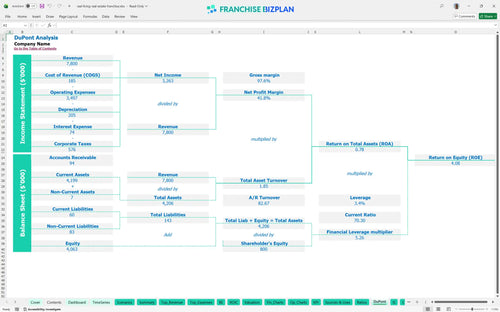
DuPont analysis
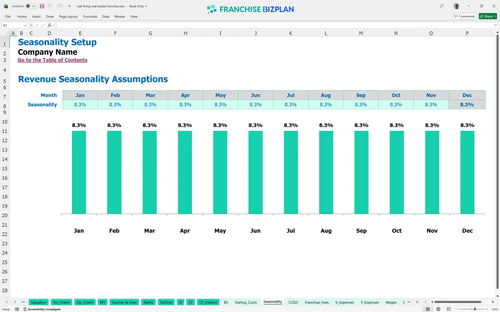
Researched revenue assumptions
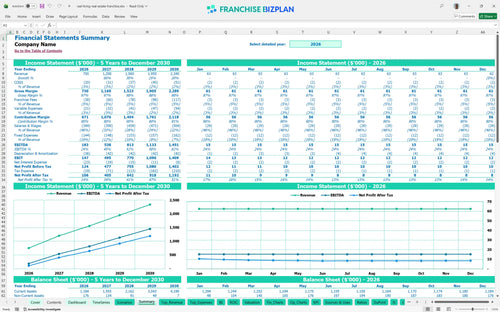
Lender-friendly financial outputs
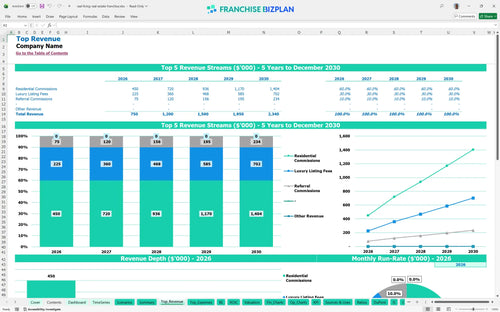
Revenue stream detailed view
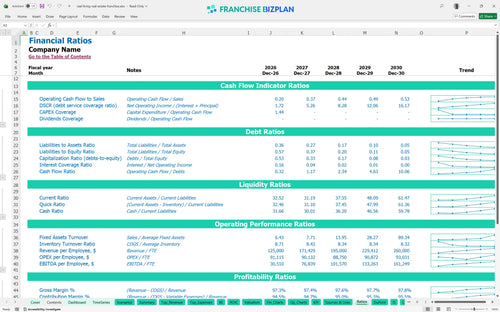
Performance metrics benchmark
We built this real estate franchise financial model based on deep industry research into high-end brokerage operations. The pre-populated data covers everything from $9,000 monthly rent in premium districts to the specific costs of VR production and AI licensing. With Year 1 EBITDA starting at $183,000 and a 5% royalty structure, this tool helps you visualize the path to a $1.45 million bottom line by Year 5.
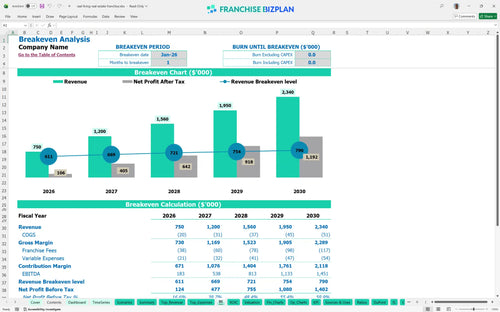
Based on the data, this unit hits break-even almost immediately in January 2026. You will see EBITDA jump from $183,000 in Year 1 to over $538,000 in Year 2 as your agent count grows from two to three full-time equivalents. The model accounts for all costs including the 5% royalty and fixed office overhead to show true net profit.
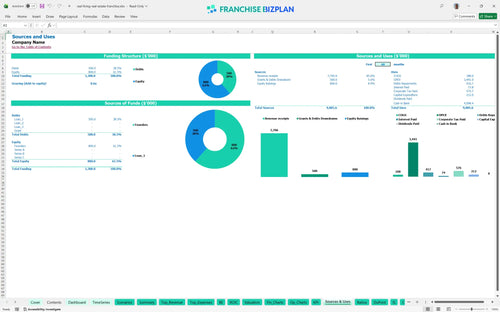
You will need approximately $212,000 in upfront capital to cover the initial franchise fee and the high-end build-out. This includes $80,000 for leasehold improvements and $30,000 for VR equipment to stay competitive in the luxury market. The model also accounts for a significant cash buffer, with minimum cash levels staying around $1.122 million to ensure smooth operations.
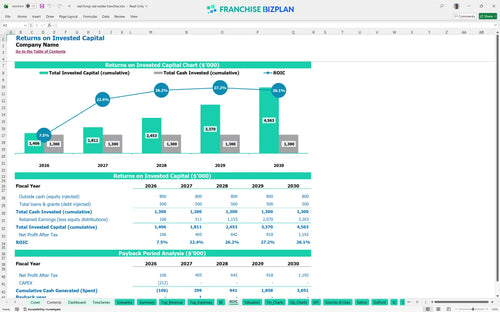
The model shows a 12.66% Internal Rate of Return (IRR) with a full payback on your initial investment within 2 years. By Year 5, the EBITDA margin is exceptionally strong, reflecting the scalability of the brokerage model as revenue reaches $2.34 million. This provides a clear picture of the long-term ROI for a multi-unit operator or a single-unit owner.
You reach break-even in month one, January 2026, provided you hit the $300,000 residential commission target for the first year. Rent at $9,000 a month is your biggest fixed hurdle, so keeping agent productivity high is vital to covering your $12,000 monthly fixed cost base. Every luxury listing fee helps shorten the gap to total cost recovery.
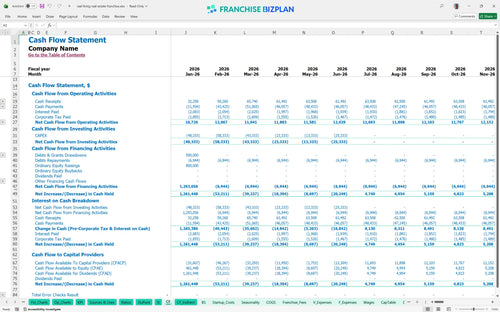
Your lowest cash point is $1.122 million in June 2026, which includes your initial capital and operating buffer. Honestly, the biggest risk is a slow ramp-up in agent recruiting, which could defintely strain your working capital if commissions lag behind the $12,000 monthly fixed burn. Maintaining a lean staff of five core roles plus agents is key to protecting your cash runway.
In a high-growth scenario where revenue scales faster than the 20% annual trend, your Year 1 margin improves significantly. Conversely, a low scenario where luxury listing fees drop by 15% would push your payback period toward Year 3. The model allows you to toggle these scenarios to see how peak cash needs and profitability timing shift based on market volatility.
Finance: update unit break-even and payback model by Friday.
This real estate franchise financial model is built in Excel so you can tweak every variable to match your specific market. It comes with pre-filled formulas and editable assumptions for everything from agent splits to local office costs, making it easy to adapt to your specific territory. Whether you are adjusting for local commission rates or specific office overhead, the logic remains intact and ready for your inputs.

Planning for a single office or a multi-unit expansion requires a long-term view of cash flow and profitability. This model tracks your trajectory from a $750,000 Year 1 revenue base up to a projected $2.34 million by Year 5. It provides a detailed 5-year outlook on revenue, costs, and profit, ensuring you can see how scaling your agent count impacts the bottom line over time.

You need to know exactly how much goes to the franchisor before you pocket a dime. This franchise business plan template calculates the 5% royalty fee against your gross commissions automatically. By mapping out these franchise-specific financial obligations, you can see the real economics of the unit after all brand-related costs are paid.

Launching a high-end brokerage involves more than just a desk and a phone. We have mapped out the $212,000 in initial capital needed for leaseholds, VR gear, and AI software. This real estate franchise startup costs tool helps you estimate the total investment and the monthly sales volume required to cover your fixed costs like the $9,000 monthly rent.

Don't fly blind when estimating your margins; use our built-in industry benchmarks to verify your numbers. The model includes typical ranges for things like staging materials (1.8%) and photography (0.9%) to ensure your projections are realistic. This allows you to compare your expected performance against typical franchise unit economics and adjust your strategy accordingly.


Simply purchase and download the financial model template, then access it instantly using Microsoft Excel or Google Sheets. No installation or technical expertise required-just open and start working.

Enter your business-specific numbers, including revenue projections, costs, and investment details. The pre-built formulas will automatically calculate financial insights, saving you time and effort.

Leverage the investor-ready format to confidently showcase your financial projections to banks, franchise representatives, or investors. Impress stakeholders with clear, data-driven insights and professional reports.

Leverage the investor-ready format to confidently present your projections to banks, franchise representatives, or investors.