
All-in-one Dashboard
Core inputs and core outputs


This franchise unit performance metrics Excel template provides a complete toolkit for forecasting hotel revenue, managing complex staffing schedules, and calculating long-term investor returns.
Core inputs and core outputs
Three scenario analysis
Presentation ready
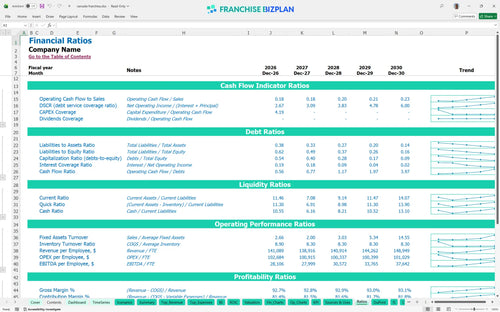
DuPont analysis
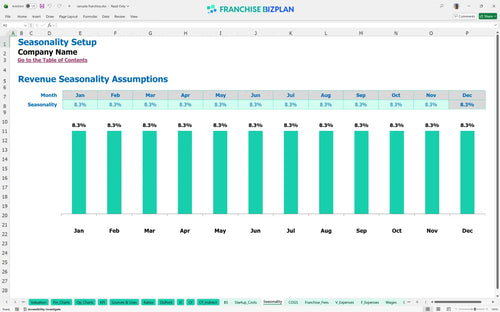
Researched revenue assumptions
Lender-friendly financial outputs
Revenue stream detailed view
Performance metrics benchmark
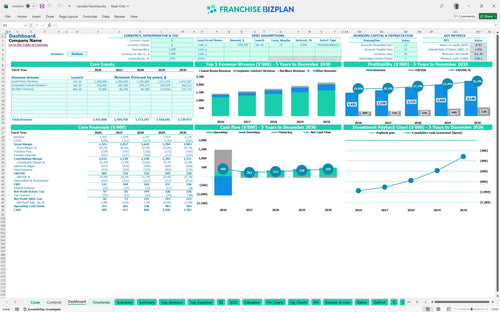
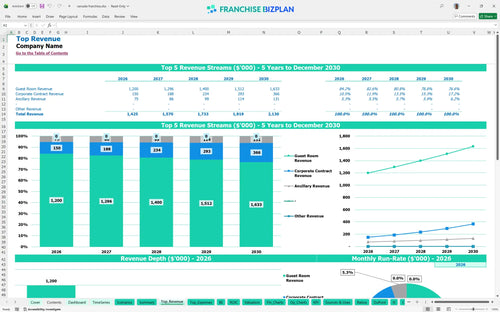
We built this midscale hotel financial model using deep industry research to ensure your projections are grounded in reality. The model comes pre-populated with data showing a Year 1 revenue of $1,425,000 and an EBITDA of $284,000, covering everything from Guest Room revenue to corporate contract streams. You can easily learn how to build a financial forecast for a hospitality business by adjusting these editable inputs to match your specific territory.
This hotel unit reaches operational profitability almost immediately, showing a positive EBITDA of $284,000 in its first year. While the monthly break-even is fast, your long-term proftability defintely depends on hospitality revenue management to offset the 9.5% OTA commission fees.
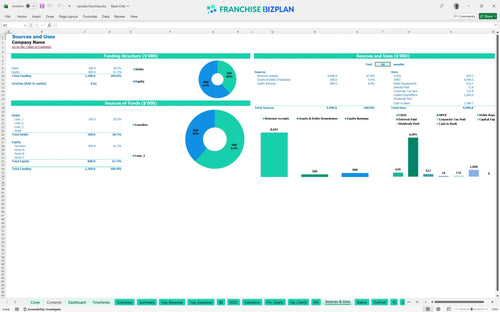
You will need approximately $1.06 million in total startup capital, plus a $336,000 cash buffer for the ramp-up phase. This covers the $35,000 franchise fee and significant leasehold improvements, making it a serious commercial real estate feasibility exercise. Here is how to calculate startup costs for a hotel franchise using our pre-built categories for a new hotel construction project.
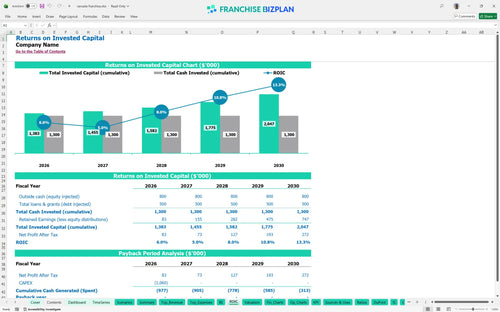
The hotel franchise investment return on investment analysis shows an IRR of 1.83% and a Return on Equity of 0.93. Because of the high initial CAPEX (capital expenditure), the full payback on your investment occurs after the five-year mark, which is typical for hotel franchise ROI in the midscale segment.
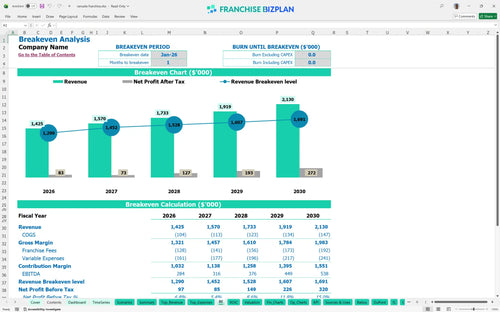
The unit hits its monthly break-even point in January 2026, just one month after launch. This assumes you hit your Year 1 revenue targets of $1.42 million while estimating operating expenses for a franchise hotel accurately, specifically managing the $18,000 monthly rent and 11.3% combined variable costs.
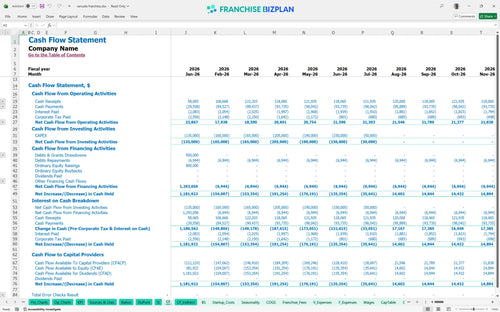
Your lowest cash point hits $336,000 in July 2026, so you need to ensure your initial funding covers this mid-year dip. This hotel franchise business plan for investors highlights that while you are profitable, the timing of FF&E payments and staffing ramp-ups can squeeze liquidity early on.
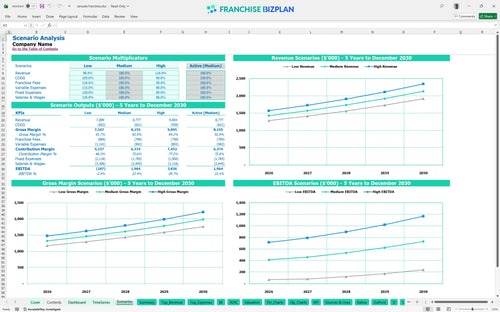
In a high-growth scenario, Year 5 revenue can climb to $2.13 million, significantly improving your EBITDA margin from 20% to 25%. This midscale hotel franchise financial projections template allows you to toggle between these cases to see how local marketing execution changes your peak cash needs.
This hotel franchise financial model is built in Excel to give you total control over your assumptions, allowing you to swap out pre-filled data for your specific site realities. You can adjust every formula and driver to see how different occupancy rates or labor shifts impact your bottom line before you sign a lease.

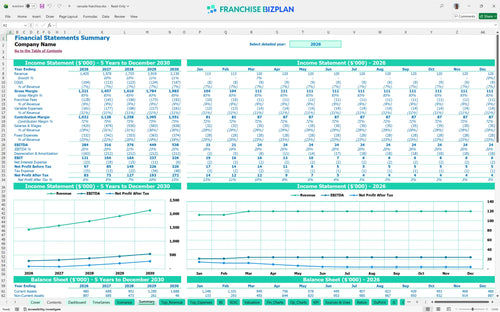
Planning a midscale hotel requires a long-range view, so we've included pro forma financial statements for hotel franchisees that span sixty months. You can track how revenue grows from $1.42 million in year one to over $2.1 million by year five while monitoring your long-term cash position. This hotel business plan template ensures you see the full mountain, not just the first step.

Analyzing hotel franchise profitability and royalty fees is critical because these costs come off the top of your revenue. This model accounts for the 5% royalty and 4% marketing fund contributions, plus the initial $35,000 entry fee, to show you exactly how much goes to the brand. Understanding this franchise royalty fee structure helps you protect your store-level margin from the start.

Launching a hotel involves significant upfront capital, and this franchise investment calculator maps out every dollar from leasehold improvements to signage. By comparing your fixed costs like the $18,000 monthly rent against your variable margins, the model identifies the exact occupancy level you need to stop losing money. It's the clearest way to see your path to operational stability.

We've integrated standard hotel operational overhead figures to help you sanity-check your projections against industry norms. Whether it's housekeeping costs starting at 4.8% of revenue or guest supplies at 2.5%, these benchmarks ensure your model isn't based on wishful thinking. Use these numbers to spot where your specific location might be overspending on labor or utilities.


Simply purchase and download the financial model template, then access it instantly using Microsoft Excel or Google Sheets. No installation or technical expertise required-just open and start working.

Enter your business-specific numbers, including revenue projections, costs, and investment details. The pre-built formulas will automatically calculate financial insights, saving you time and effort.

Leverage the investor-ready format to confidently showcase your financial projections to banks, franchise representatives, or investors. Impress stakeholders with clear, data-driven insights and professional reports.

Leverage the investor-ready format to confidently present your projections to banks, franchise representatives, or investors.