
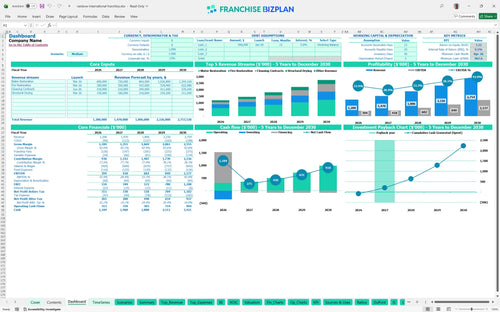
All-in-one Dashboard
Core inputs and core outputs


This franchise profitability analysis spreadsheet includes a comprehensive suite of financial statements, CAPEX schedules, and scenario tools tailored for property restoration operators.
Core inputs and core outputs
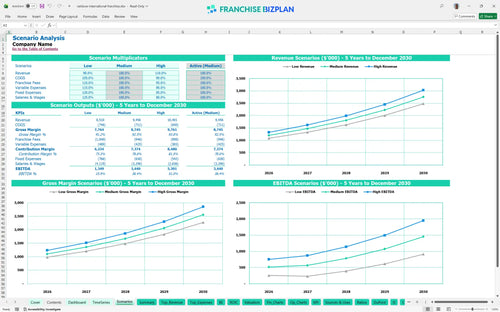
Three scenario analysis
Presentation ready
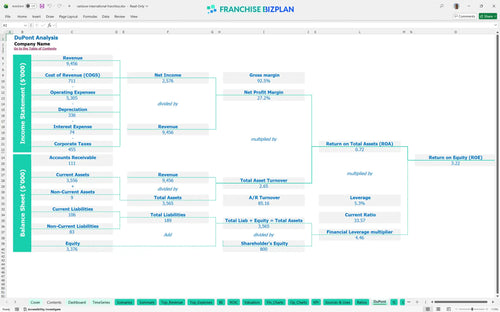
DuPont analysis
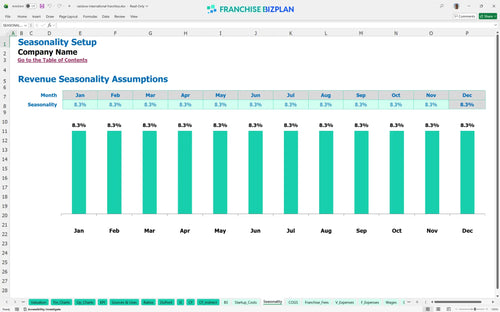
Researched revenue assumptions
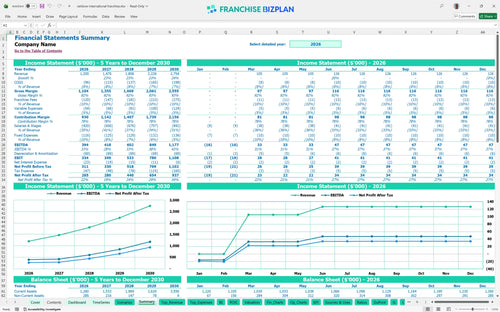
Lender-friendly financial outputs
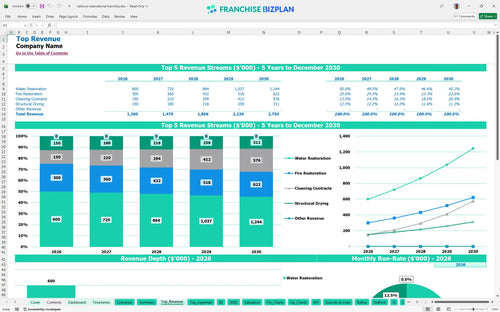
Revenue stream detailed view
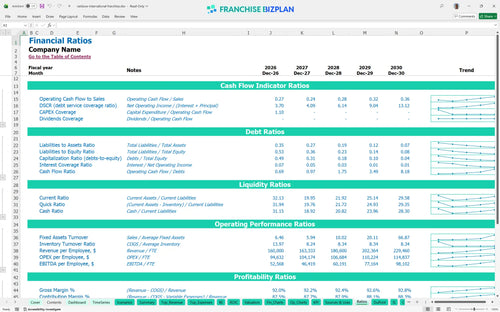
Performance metrics benchmark
We built this model for preparing a business plan for an emergency restoration startup using researched data on revenue streams and operating costs. The model is pre-populated with key metrics like the $1.2M Year 1 revenue target and the 8% royalty structure, which are fully editable to match your local territory. This defintely helps you visualize the path from the initial $40,000 franchise fee to a mature $2.7M annual revenue operation.
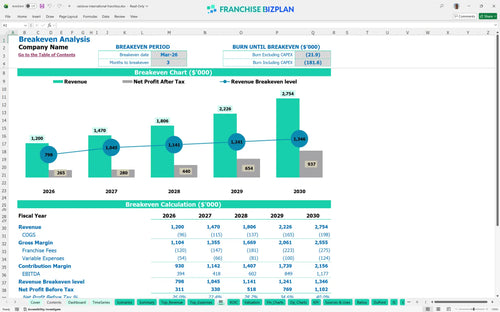
This unit is projected to reach profitability in March 2026, just three months after launch. By estimating profitability for a new franchise unit through the lens of a $394,000 Year 1 EBITDA, you can see that high-margin water restoration services drive the early wins.
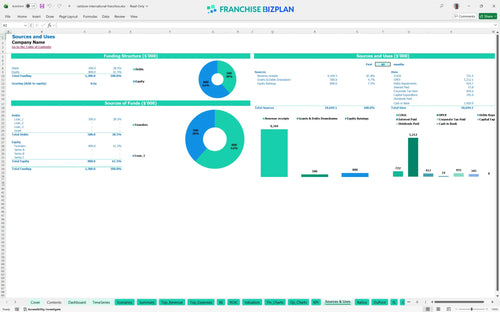
You need $345,000 to launch this disaster recovery business startup, covering everything from the initial fee to your fleet. This includes $120,000 for service vehicles and $60,000 for specialized equipment, so knowing how to calculate startup costs for a restoration franchise is vital for your loan application.
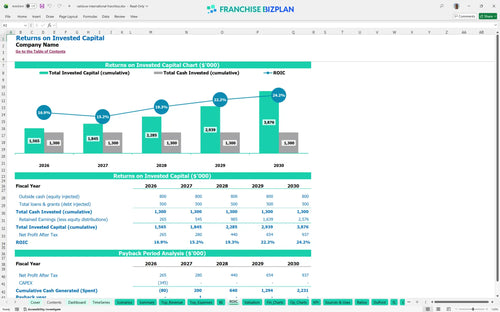
The franchise ROI calculation shows a 9.45% IRR and a 2-year payback period, which is a solid result for this industry. Analyzing recurring revenue streams for restoration businesses shows that by Year 5, your net margin remains strong even as you scale your technician headcount.
The unit hits the monthly break-even point in Month 3 by covering $10,100 in fixed costs like rent and insurance. Your unit economics for franchises depend heavily on maintaining a 30-minute response time to capture high-value water restoration jobs that carry the fixed overhead.
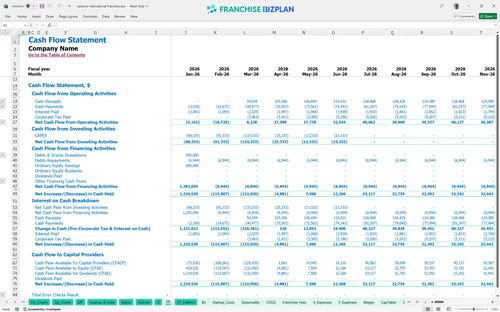
The lowest cash point occurs in April 2026 at $968,000, assuming a significant initial funding round. This small business financial projection template suggests you maintain a healthy buffer to handle the lag between completing a job and receiving insurance-backed claim payouts.
Our financial model template for water and fire restoration business compares scenarios where revenue grows from $1.2M to $2.75M. This franchise unit financial projections for property restorationn model shows that hitting the high case requires aggressive local marketing and a 3.22 ROE.
This franchise financial model template is a fully customizable Excel tool designed for the restoration sector. It features pre-filled formulas and editable assumptions, allowing you to adjust revenue drivers and local labor rates to fit your specific market. It is the same professional-grade Excel spreadsheet for franchise business financial forecasting that I use to vet multi-unit deals.

Planning for the long term requires more than a simple gut feeling; you need a detailed restoration business financial plan. This model provides a 5-year outlook on revenue, cash flow, and profitability, helping you see how scaling from 4 to 8 technicians impacts your bottom line. It maps out the transition from a single-territory startup to a mature, high-volume operation.

Operating a brand-name unit involves specific financial obligations that can squeeze margins if not managed. This tool simplifies calculating royalties and franchise fees in financial models by automating the 8% royalty and 2% marketing fund math. It serves as a financial planning guide for cleaning and restoration franchise owners who need to track every dollar leaving the business.

Knowing your total investment is the first step, but understanding when you stop losing money is more important. Our franchise startup cost calculator breaks down the $345,000 initial investment and identifies the exact sales volume needed to cover your $10,100 monthly fixed costs. This startup budget template for local restoration service providers ensures you aren't caught off guard by pre-opening expenses.

This cleaning and restoration franchise model incorporates industry-standard benchmarks to help you sanity-check your operating costs. Whether you are looking at the 5.5% restoration materials cost or the 3.2% fuel allocation, you can compare your projections against typical franchise performance. It ensures your unit economics for franchises remain realistic and achievable in a competitive metropolitan corridor.


Simply purchase and download the financial model template, then access it instantly using Microsoft Excel or Google Sheets. No installation or technical expertise required-just open and start working.

Enter your business-specific numbers, including revenue projections, costs, and investment details. The pre-built formulas will automatically calculate financial insights, saving you time and effort.

Leverage the investor-ready format to confidently showcase your financial projections to banks, franchise representatives, or investors. Impress stakeholders with clear, data-driven insights and professional reports.

Leverage the investor-ready format to confidently present your projections to banks, franchise representatives, or investors.