
All-in-one Dashboard
Core inputs and core outputs


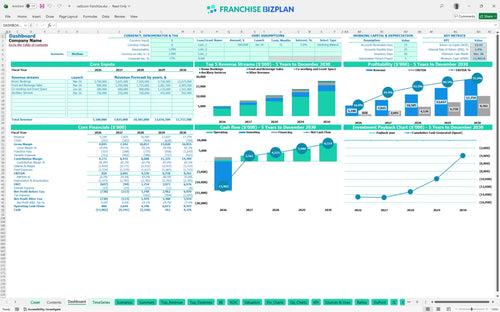
This comprehensive hotel business plan template with financial projections includes everything from room booking revenue streams to detailed capital expenditure planning for a turnkey investment analysis.
Core inputs and core outputs
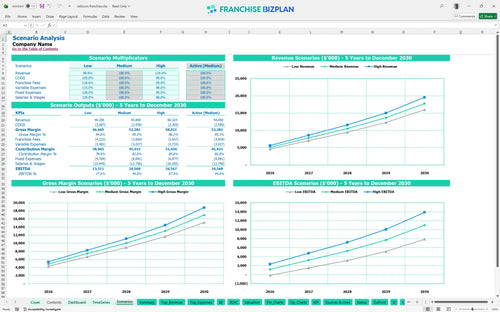
Three scenario analysis
Presentation ready
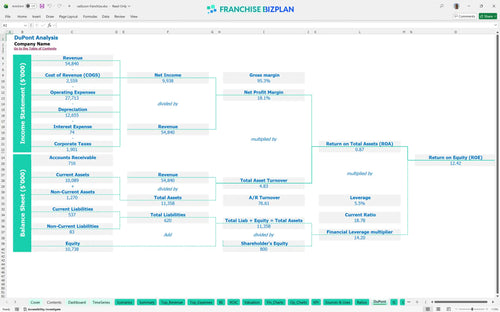
DuPont analysis
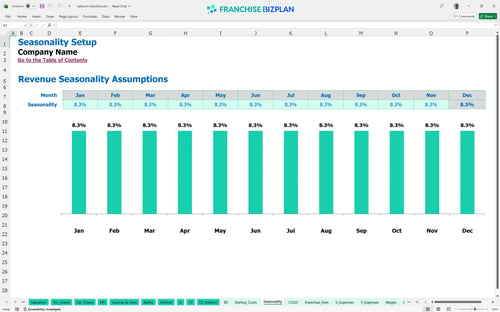
Researched revenue assumptions
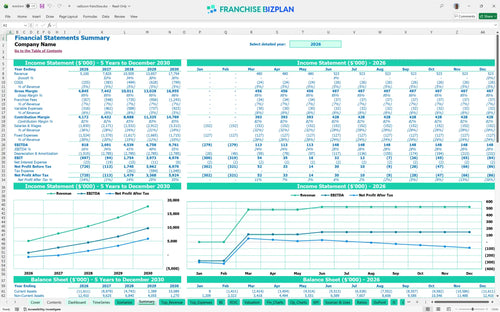
Lender-friendly financial outputs
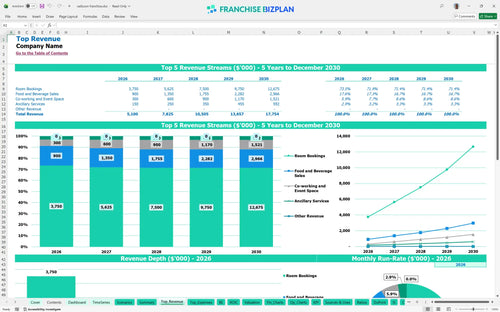
Revenue stream detailed view
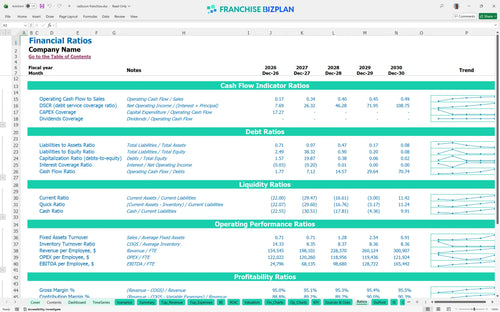
Performance metrics benchmark
We built this franchise unit financial model using intensive research into upscale hospitality standards and urban market data. Key assumptions, including the $5.1 million Year 1 revenue target and the 5% royalty structure, are pre-populated with researched data and are fully editable to match your specific location. This tool provides a clear view of how room bookings, food sales, and co-working revenue drive an EBITDA that reaches $9.7 million by Year 5.
The unit reaches profitability early in the first year, generating $818,000 in EBITDA by the end of Year 1. Profitability scales significantly as revenue grows from $5.1 million to over $17.7 million by Year 5, driven by a sophisticated revenue management strategy and increasing occupancy.
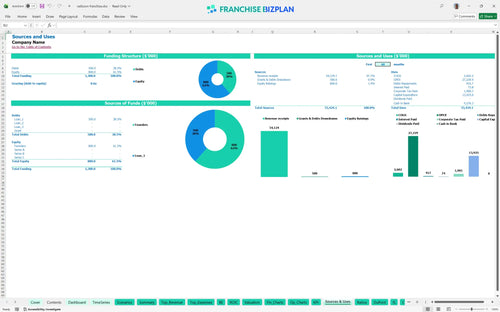
The total initial investment exceeds $13.7 million to launch this upscale unit in the US. This includes $8,000,000 for leasehold improvements, $2,000,000 for furniture and equipment, and a $75,000 franchise fee, plus a significant cash buffer for the ramp-up phase.
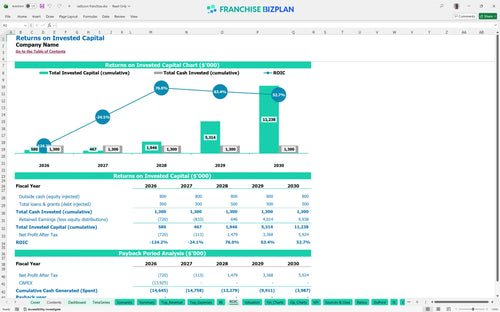
Investors can expect an Internal Rate of Return (IRR) of 1.43% and a Return on Equity (ROE) of 12.42% over the initial five-year period. Due to the heavy $13.7M+ hotel capital expenditure planning, the full payback of the initial investment occurs after Year 5, though annual cash flow becomes very strong by Year 3.
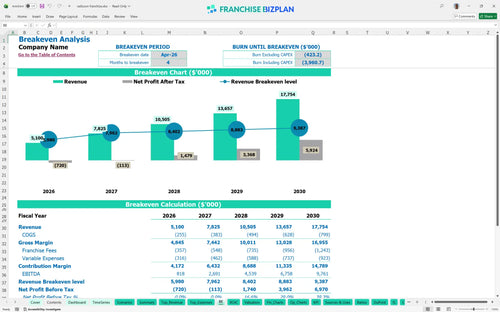
The unit reaches its monthly break-even point in April 2026, just four months after the March launch. This quick break-even is defintely dependent on hitting the $2.5 million Year 1 room booking target while managing the $50,000 monthly lease and $110,000+ in monthly fixed operating costs.
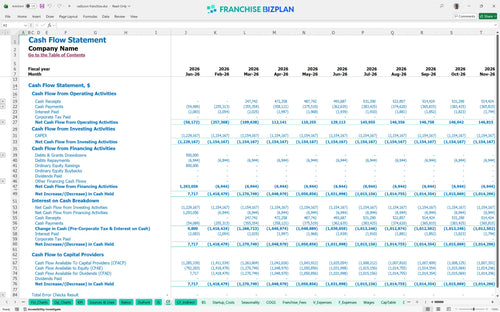
The lowest cash point occurs in December 2026, reaching a deficit of $11.9 million due to the massive upfront construction and technology costs. You need a robust financing plan or equity partner to cover this gap until the high-volume revenue from Year 2 and Year 3 begins to replenish the accounts.
A High scenario, driven by a 10% increase in average daily rate, can pull the payback period into Year 5 and double Year 1 EBITDA. Conversely, a Low scenario with weak corporate demand would deepen the peak cash need and require an additional $1.5 million in working capital to survive the first 18 months.
Finance: update unit break-even and payback model by Friday.
This hotel franchise financial model is built in Excel for maximum flexibility, allowing you to toggle every driver from room rates to occupancy levels. The pre-filled formulas handle the heavy lifting, so you can focus on adjusting editable assumptions like seasonal demand or local labor rates to fit your specific market. It is a plug-and-play franchise unit business plan template designed for speed and precision.

Plan your long-term success with detailed 5-year revenue, cost, cash flow, and profit projections tailored for a hospitality asset. This model helps you visualize the transition from a new opening to a mature unit, providing a clear hospitality franchise financial projection that accounts for annual escalations and market growth. You can track how scaling operations impact your bottom line over a half-decade horizon.

Understanding the real cost of brand affiliation is critical for any hotel franchise startup costs analysis. This model captures specific financial obligations, including the initial $75,000 fee, ongoing 5% royalty payments, and 2% brand marketing fund contributions. By automating these calculations, you can see exactly how much gross revenue stays in the unit versus what is paid to the franchisor.

Estimate your total hotel franchise startup costs with a detailed breakdown of build-out, equipment, and pre-opening expenses. The model includes a franchise profitability analysis that calculates the sales volume required to cover both your $117,000 in monthly fixed costs and your variable expenses. This ensures you know the exact occupancy and average daily rate needed to keep the doors open.

The model incorporates built-in industry benchmarks to help you perform a reality check on your hospitality industry benchmarking data. Compare your expected labor costs, which include a $150,000 General Manager salary and a large housekeeping team, against typical upscale hotel standards. These benchmarks help you identify if your projected margins are realistic or if your operating expense breakdown for hotel franchise units is out of sync with the market.


Simply purchase and download the financial model template, then access it instantly using Microsoft Excel or Google Sheets. No installation or technical expertise required-just open and start working.

Enter your business-specific numbers, including revenue projections, costs, and investment details. The pre-built formulas will automatically calculate financial insights, saving you time and effort.

Leverage the investor-ready format to confidently showcase your financial projections to banks, franchise representatives, or investors. Impress stakeholders with clear, data-driven insights and professional reports.

Leverage the investor-ready format to confidently present your projections to banks, franchise representatives, or investors.