
All-in-one Dashboard
Core inputs and core outputs


This product is a comprehensive Excel template for franchise unit financial planning designed to help you evaluate a gas station franchise investment with precision.
Core inputs and core outputs
Three scenario analysis
Presentation ready
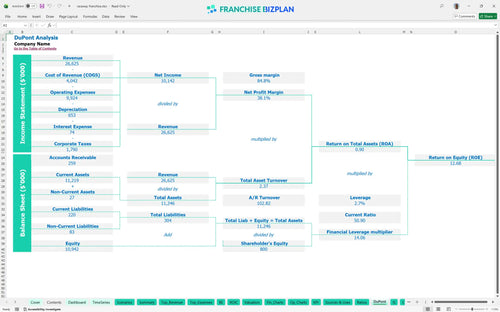
DuPont analysis
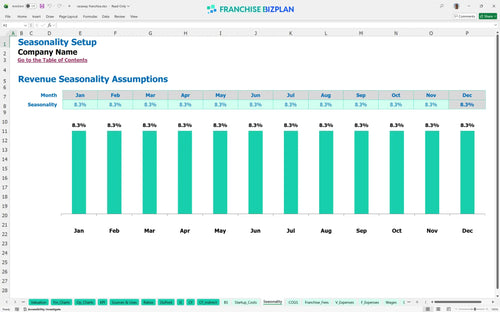
Researched revenue assumptions
Lender-friendly financial outputs
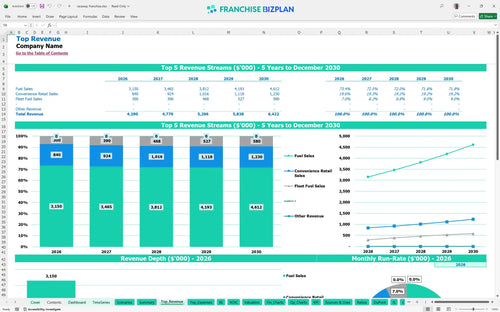
Revenue stream detailed view
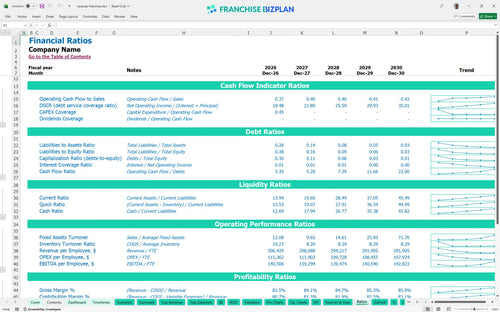
Performance metrics benchmark
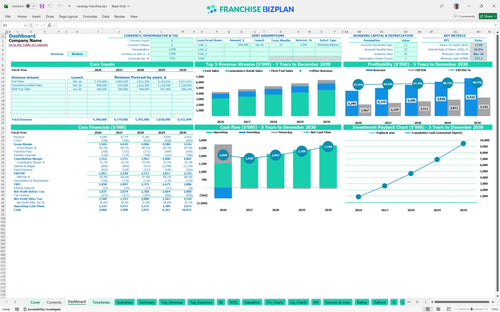
We built this franchise unit financial model using our own research on high-volume retail fuel sites. Key assumptions like the 5% royalty, 2% marketing fund, and $4.29M year-one revenue are pre-populated and fully editable to help you understand the unit economics. Honestly, the speed to profit is impressive here.
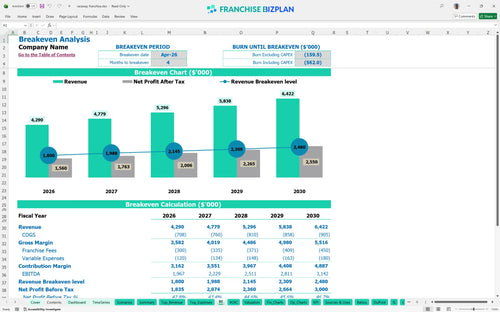
The unit becomes profitable in April 2026, just four months after launching. This rapid turnaround is driven by high-volume fuel sales and a lean initial staffing model. By the end of the first year, you are looking at an EBITDA of $1,967,000 after all royalties and fixed costs are paid. Here is the quick math: how to calculate gas station profit margins depends on keeping your fuel procurement costs at or below 12.5%.
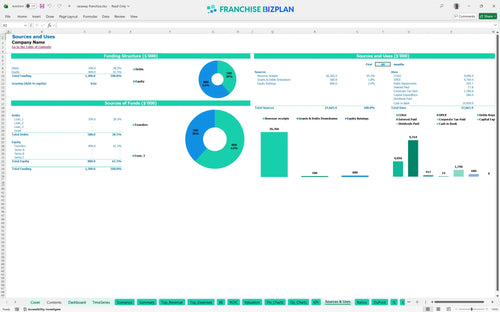
Launching this unit in the US requires a total startup capital of approximately $1,397,000. This includes $680,000 for hard assets like pumps and store improvements, plus a $717,000 cash buffer to handle the ramp-up phase. The model shows that the largest single expense is the $200,000 for leasehold improvements, followed by $150,000 for fuel dispensers.
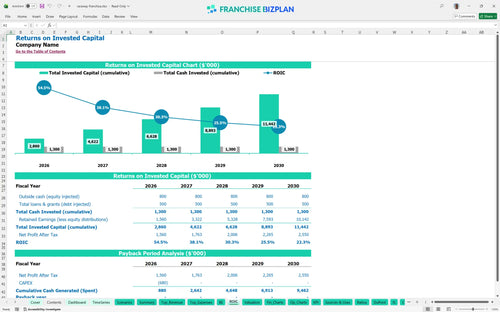
When you perform an ROI analysis on this concept, the internal rate of return (IRR) stands at 20.78%. While the annual net margins are strong, the high initial investment means your full payback period extends just past the five-year mark. Still, the return on equity of 12.68% shows this is a stable, long-term wealth-building play for a patient operator. This is how to evaluate a gas station franchise investment beyond just the monthly cash flow.
The monthly break-even point is reached in April 2026, requiring enough volume to cover $41,300 in monthly fixed costs, including rent and utilities. The primary driver for this profitability analysis for fuel station business is fuel volume; even a small dip in gallons pumped can push your break-even date back. You must maintain a high average ticket in the convenience store to offset the lower margins on fuel.
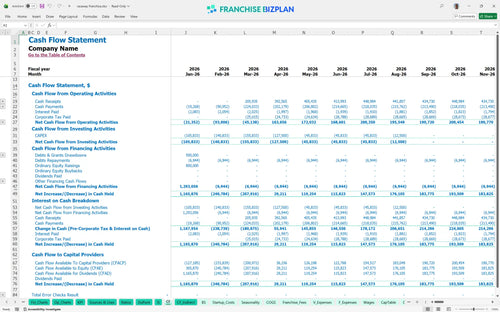
Your lowest cash point occurs in March 2026, with a minimum cash balance of $717,000. This suggests you need a significant liquidity cushion during the construction and permit phase. Estimating operating costs for retail franchises is tricky, but the model provides a 6-month buffer to protect against delays in canopy construction or fuel pump installation. If opening takes 90+ days longer than planned, working capital pressure will rise defintely.
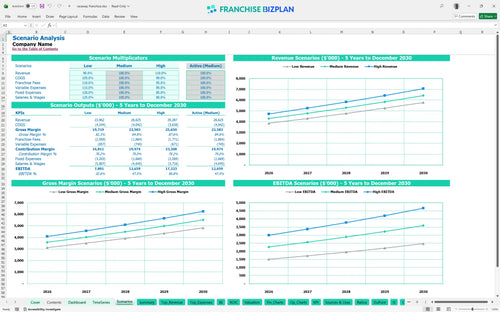
The model compares Low, Medium, and High scenarios to show how sensitive the unit is to market shifts. In the High scenario, aggressive commercial fleet account revenue projections can boost year-one EBITDA by 15% or more. Conversely, the Low case shows that a 10% drop in fuel volume significantly delays the payback period and increases the peak cash need during the first year. Productivity and local marketing execution are the main differentiators between these outcomes.
To move forward, you must validate these projections against your specific site's traffic counts and local competitive fuel pricing. A detailed site-level review will ensure your labor and rent assumptions reflect the North Charlotte market realities. Finance: update unit break-even and payback model by Friday.
This franchise financial model template is built in Excel with fully editable assumptions, allowing you to swap our researched data for your specific site realities. You can adjust fuel margins, convenience store inventory turnover, and local labor rates to see how they impact your bottom line. The convenience store business financial model excel format means every formula is transparent and ready for your custom inputs.

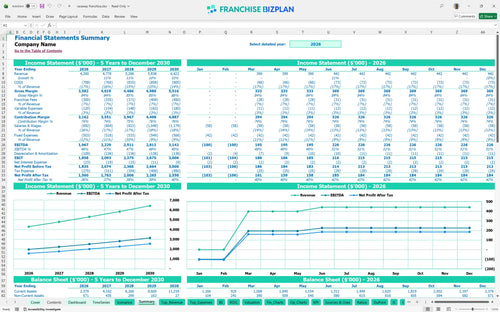
Planning for a long-term exit or multi-unit expansion requires a gas station franchise business plan that looks five years into the future. This model provides detailed revenue forecasting and cash flow projections, showing how your EBITDA grows from $1.96 million in year one to over $3.14 million by year five. It gives you a clear balance sheet view to track equity and debt over the life of the investment.

Understanding the unit economics of a fuel station means accounting for every dollar that leaves the store before you see a profit. This tool tracks the 5% royalty fee and 2% marketing fund contributions against your convenience store financial projection to show true net margin. It ensures you factor in the upfront franchise fee and ongoing brand obligations so there are no surprises in your monthly P&L.

Our franchise startup costs spreadsheet helps you map out the $680,000 required for equipment and improvements before you pump a single gallon. By analyzing fixed costs like the $28,000 monthly rent against variable fuel procurement, the franchise investment calculator identifies exactly what volume you need to hit. This clarity helps you manage the gap between your grand opening and reaching a stable cash-flow-positive state.

This franchise unit financial forecasting tool includes built-in benchmarks to help you sanity-check your labor and occupancy costs against industry standards. If your fuel procurement costs or cashier wages drift too far from the researched norms, the model flags the variance. It is a vital tool for any operator needing to justify their projections to lenders or partners using realistic performance ranges.


Simply purchase and download the financial model template, then access it instantly using Microsoft Excel or Google Sheets. No installation or technical expertise required-just open and start working.

Enter your business-specific numbers, including revenue projections, costs, and investment details. The pre-built formulas will automatically calculate financial insights, saving you time and effort.

Leverage the investor-ready format to confidently showcase your financial projections to banks, franchise representatives, or investors. Impress stakeholders with clear, data-driven insights and professional reports.

Leverage the investor-ready format to confidently present your projections to banks, franchise representatives, or investors.