
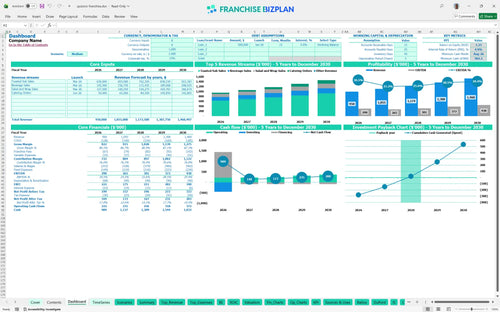
All-in-one Dashboard
Core inputs and core outputs


This franchise business plan financial projections tool includes a complete Excel template for franchise unit cash flow forecasting, pre-loaded with specific capex, labor, and revenue assumptions for a high-volume sandwich shop.
Core inputs and core outputs
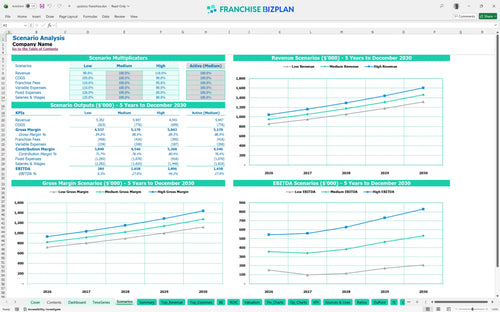
Three scenario analysis
Presentation ready
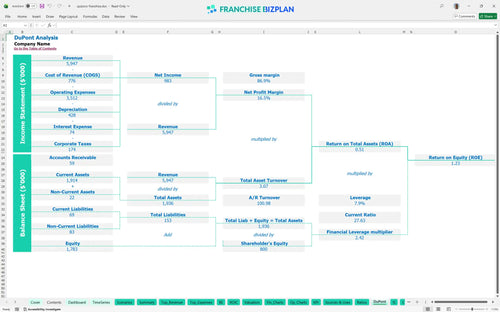
DuPont analysis
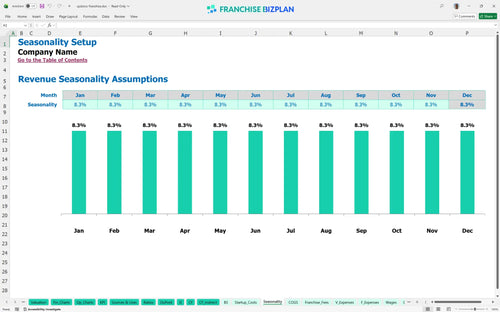
Researched revenue assumptions
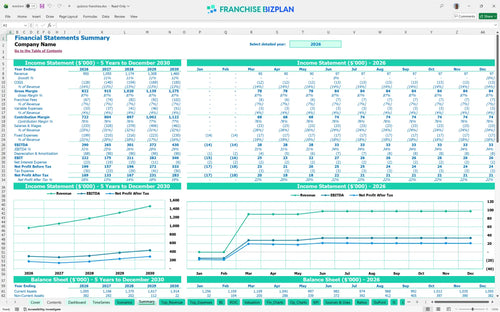
Lender-friendly financial outputs
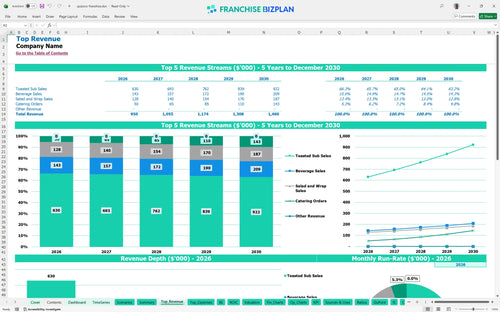
Revenue stream detailed view
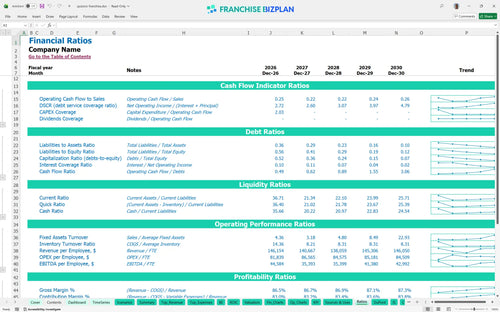
Performance metrics benchmark
We built this franchise unit financial model using our own research to ensure your projections are grounded in reality. Key assumptions like the $950,000 revenue target and 5% royalty are pre-populated with researched data specific to Quiznos Franchise franchise unit and are fully editable. This tool helps you move from guessing to planning with real-world numbers.
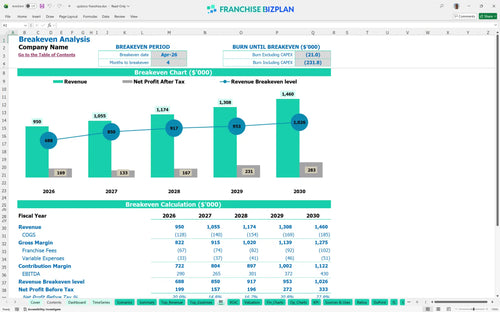
This unit reaches profitability by April 2026, just four months after the March launch. By Year 3, you are looking at an EBITDA of $301,000 after accounting for all food ingredients, the 5% royalty, and the 2% marketing fund. Profit is a habit, not an accident.
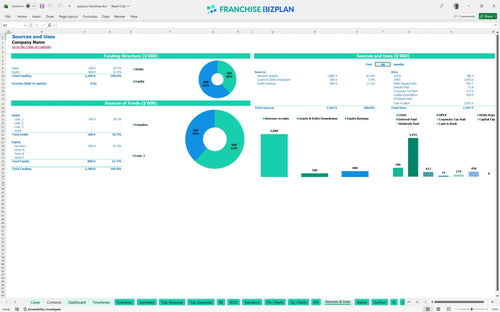
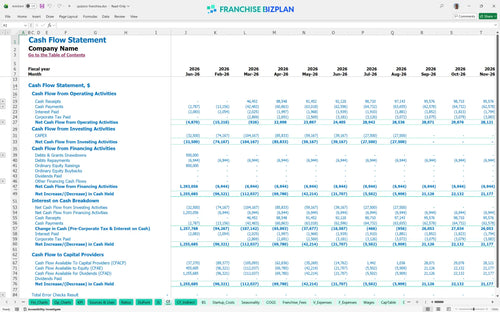
Launching this unit requires a total upfront investment of approximately $450,000 for capital expenditure planning. This includes a $5,000 initial fee and a $220,000 build-out for a flagship location, plus you need to account for the $902,000 minimum cash requirement seen in August 2026. Capital is fuel; don't run out before the first turn.
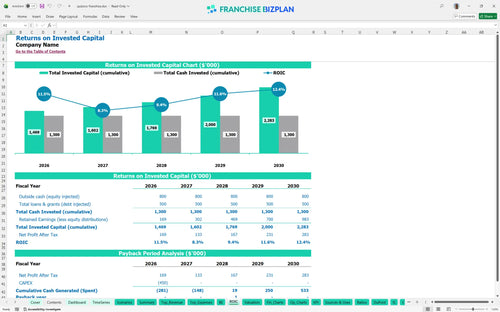
This QSR franchise investment return calculator shows a 3-year payback period, which is healthy for the fast-casual sector. The Internal Rate of Return (IRR) stands at 4.9% with a Return on Equity (ROE) of 1.23 based on the five-year growth plan. Time is the most expensive ingredient in any kitchen.
To cover your $12,000 monthly rent and $15,000 in base management salaries, you need to hit break-even within 4 months. How to forecast revenue for a university area restaurant depends on hitting the $79,000 monthly average to offset these high fixed occupancy costs. Volume hides a lot of sins, but it won't fix a bad lease.
Your tightest window occurs in August 2026, where minimum cash hits $902,000. This financial feasibility study for new restaurant franchise suggests you need significant runway to survive the gap between leasehold payments and mature sales volume. Runway is measured in months, but survival is measured in days.
A High-growth scenario could push Year 1 revenue past $1M, but estimating labor and food costs for fast casual franchise accurately is the only way to protect the $290,000 Year 1 EBITDA. If food costs spike above the 11.5% target, your cash runway will shrink rapidly. Plan for the worst, but execute for the best.
Begin by auditing your local market data against our Austin-based benchmarks to ensure your franchise unit economics are realistic. This startup budget template for retail food service locations is designed for immediate use, but best practices for franchise financial modeling require regular updates. Accuracy today prevents insolvency tomorrow.
Finance: update unit break-even and payback model by Friday.
This franchise unit financial model lives in Excel, giving you total control over every line item. You can swap out the pre-filled data for your specific territory or adjust the 11.5% food cost assumption if your local supply chain differs. It is a flexible franchise startup cost spreadsheet that lets you stress-test different labor models or rent hikes before signing a lease. Every 1-point margin leak matters fast in a single-unit model.

Building a multi-unit empire starts with a clear view of the long game. This model tracks your trajectory from a $950,000 year-one revenue base up to $1,460,000 by year five. It defintely helps you visualize how annual EBITDA (earnings before interest, taxes, depreciation, and amortization) scales as you optimize throughput and manage the 5% royalty burden over half a decade. Multi-unit success is just a series of well-executed single-unit models.

Royalties and marketing funds are the franchise tax that can squeeze a store-level P&L (profit and loss) if you are not careful. This tool automates the math for the 5% royalty and 2% brand fund, showing exactly how much cash leaves the unit every month. Analyzing franchise royalty and marketing fees in Excel ensures you know your true contribution margin after the franchisor takes their cut. You can't manage what you don't model.

Knowing how to calculate startup costs for a sandwich franchise is the difference between a smooth opening and a cash crunch. With $220,000 allocated for leasehold improvements and $140,000 for kitchen gear, your total entry cost is significant. This break-even analysis for franchise units pinpoints the exact month-April 2026 in our base case-where your toasted sub sales finally cover the $12,000 monthly rent and overhead. Cash is more important than your ego on opening day.

Do not guess on your food franchise investment analysis. We have baked in realistic benchmarks, like the 13.5% total COGS (cost of goods sold) and standard labor allocations for operating expenses for restaurants in a fast-casual environment. These guardrails help you see if your $65,000 manager salary or 1.5% payment processing fees align with top-tier performance standards. Benchmarks are the guardrails that keep your business on the road.


Simply purchase and download the financial model template, then access it instantly using Microsoft Excel or Google Sheets. No installation or technical expertise required-just open and start working.

Enter your business-specific numbers, including revenue projections, costs, and investment details. The pre-built formulas will automatically calculate financial insights, saving you time and effort.

Leverage the investor-ready format to confidently showcase your financial projections to banks, franchise representatives, or investors. Impress stakeholders with clear, data-driven insights and professional reports.

Leverage the investor-ready format to confidently present your projections to banks, franchise representatives, or investors.