
All-in-one Dashboard
Core inputs and core outputs


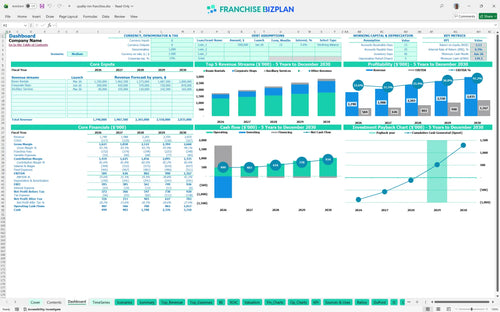
This hospitality financial projection spreadsheet integrates room night sales, corporate accounts, and ancillary revenue into a single, cohesive dashboard for owner-operators.
Core inputs and core outputs
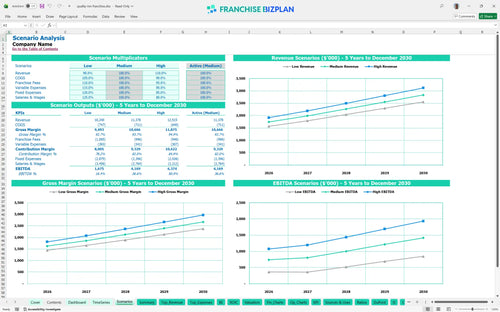
Three scenario analysis
Presentation ready
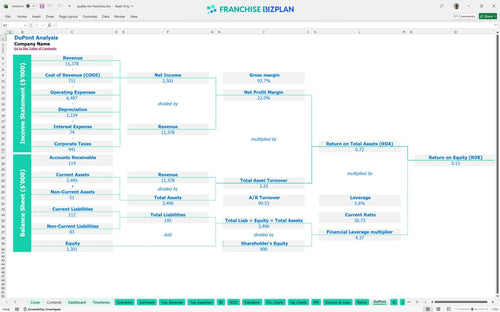
DuPont analysis
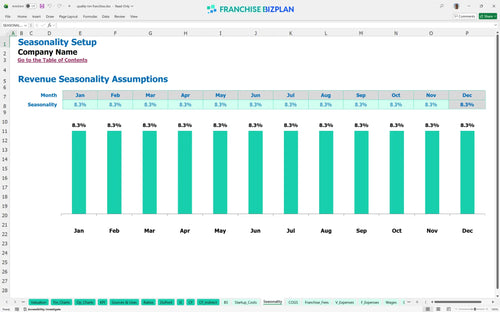
Researched revenue assumptions
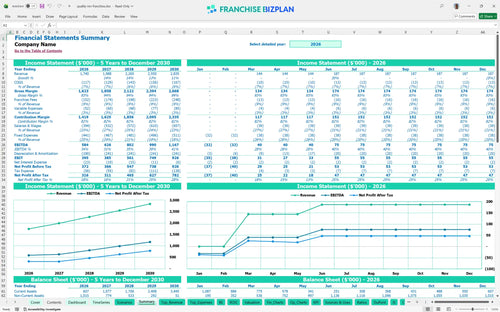
Lender-friendly financial outputs
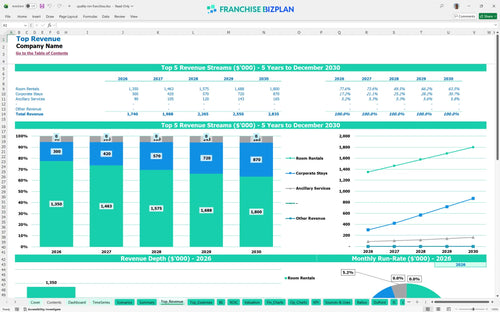
Revenue stream detailed view
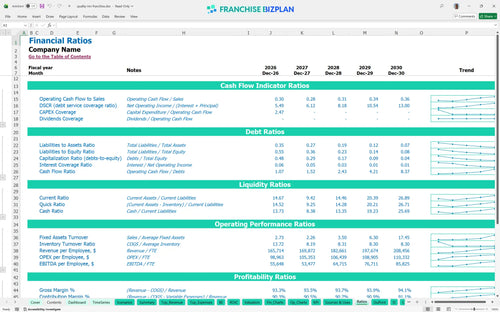
Performance metrics benchmark
We developed this financial feasability study for hotel franchise owners using detailed market research and brand standards. The model includes pre-populated data for room rentals starting at $900,000 and corporate stays, alongside fixed costs like the $25,000 monthly lease. You can use this tool to learn how to create a financial model for a hotel franchise that reflects your specific market conditions.
This unit is defintely built for growth, reaching a positive EBITDA of $584,000 in its first year. By year five, analyzing mid-scale hotel franchise profitability shows EBITDA climbing to $1,167,000 as corporate stay revenue scales from $200,000 to $580,000. Growth is the only way to outrun fixed costs.
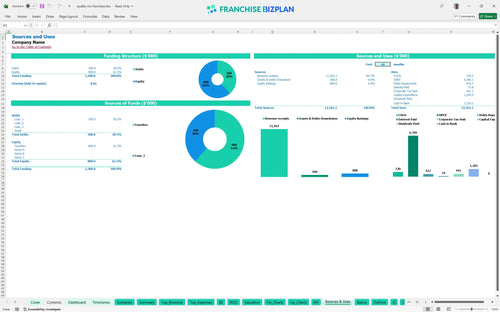
The total hotel capital expenditure budget for this unit is approximately $1,204,895. This covers the $89,895 franchise fee, $650,000 in leasehold improvements, and $220,000 for furniture and fixtures to meet brand standards. Build-out is always your biggest check.
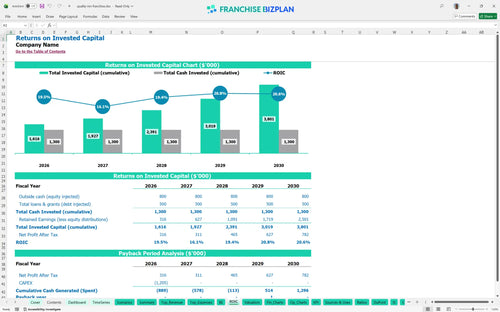
Investors can expect a 4.31% IRR and a 3.13 return on equity over the initial term. This franchise ROI calculation results in a 4-year payback period, which is standard for essential financial metrics for hospitality investors in the mid-scale segment. Cash on cash is the metric that matters.
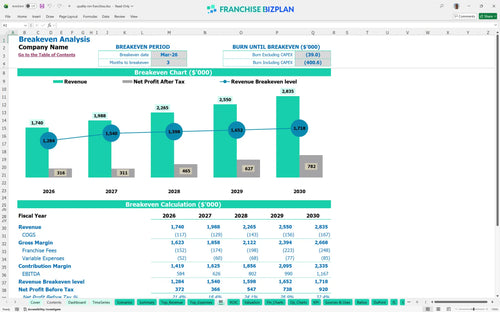
Calculating break-even point for a new hotel franchise shows the unit hits the mark in Mar-2026, just 3 months after launch. Break-even depends heavily on revenue per available room forecasting and managing hotel operational expenses like the $25,000 monthly rent. Speed to break-even determines your survival.
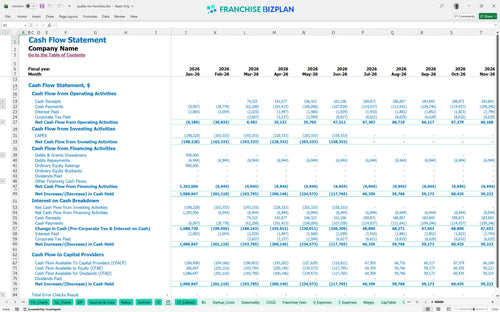
The lowest cash point is $139,000 in Jun-2026 during the initial ramp-up phase. Managing hotel franchise operating expenses in Excel helps you monitor this buffer to ensure you cover the $4,500 monthly utilities and $1,800 maintenance costs. Watch the dip in month six.
Projecting revenue for a limited-service hotel property across scenarios shows that hitting the high case accelerates the $2,835,000 revenue target. Variations in OTA commissions and breakfast supply costs significantly impact the year-1 EBITDA of $584,000. Execute the high case or don't start.
Finance: update unit break-even and payback model by Friday.
This hotel franchise financial model is a fully customizable Excel tool designed for precision. You can adjust pre-filled formulas and editable assumptions to match your specific territory, whether you are looking at a property conversion or a new build. It serves as a comprehensive franchise unit financial forecasting template that adapts to your unique operating scenario. Every cell is open for your input.

Success in hospitality requires looking past the grand opening to understand long-term sustainability. This model provides a detailed 5-year outlook on revenue, costs, and cash flow, acting as a financial planning guide for prospective hotel franchisees. You get a clear view of long-term profitability and the balance sheet strength needed to sustain a multi-unit growth strategy. Plan for five years, not just five months.

The franchise royalty fee structure is baked directly into the math, ensuring you never miss a payment obligation. The model tracks the 5.25% royalty and 3.5% marketing fund contributions against gross room rentals and corporate stays. This allows you to see the real store-level margin after the brand takes its cut. Royalties are a top-line tax you must model.

Getting the hotel startup cost estimation right prevents mid-project capital calls. This Excel spreadsheet for hotel franchise startup costs covers everything from the $89,895 initial fee to $650,000 in leasehold improvements. It identifies the exact sales volume needed to cover your fixed rent of $25,000 and variable guest supply costs. Know your number before you sign the lease.

Use this model to sanity-check your projections against industry standards for mid-scale hospitality. It includes built-in benchmarks for labor and occupancy, helping you verify if your 4.2% guest supply cost is realistic. It is an essential franchise investment analysis tool for any serious operator looking to minimize margin leak. Compare your dream to the market reality.


Simply purchase and download the financial model template, then access it instantly using Microsoft Excel or Google Sheets. No installation or technical expertise required-just open and start working.

Enter your business-specific numbers, including revenue projections, costs, and investment details. The pre-built formulas will automatically calculate financial insights, saving you time and effort.

Leverage the investor-ready format to confidently showcase your financial projections to banks, franchise representatives, or investors. Impress stakeholders with clear, data-driven insights and professional reports.

Leverage the investor-ready format to confidently present your projections to banks, franchise representatives, or investors.