
All-in-one Dashboard
Core inputs and core outputs


This fast-casual restaurant financial model template provides a complete framework for analyzing the investment, operating costs, and multi-year profit potential of a modern franchise location.
Core inputs and core outputs
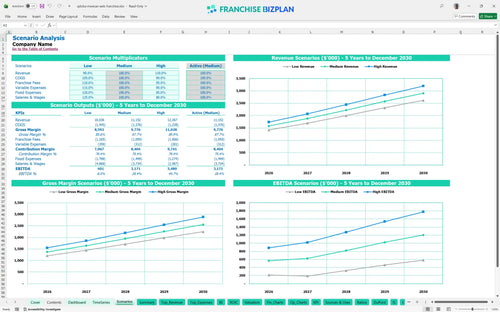
Three scenario analysis
Presentation ready
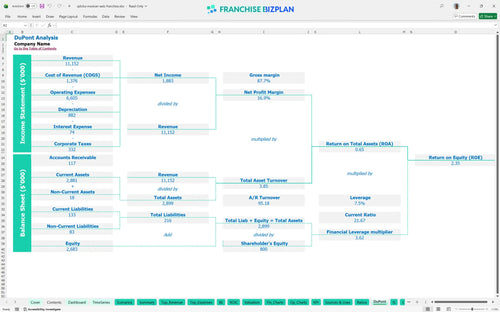
DuPont analysis
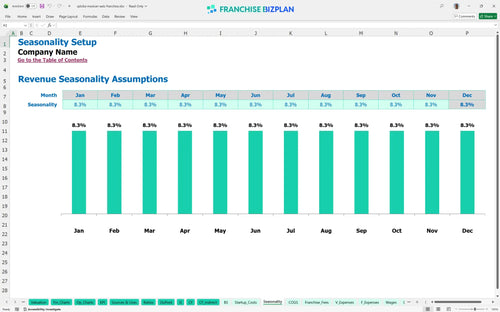
Researched revenue assumptions
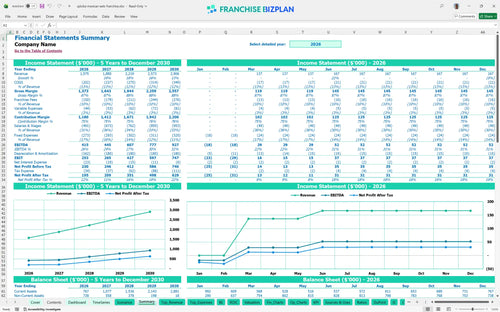
Lender-friendly financial outputs
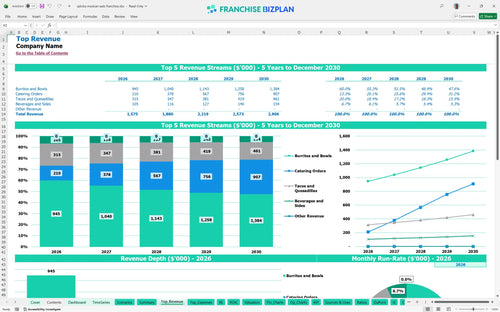
Revenue stream detailed view
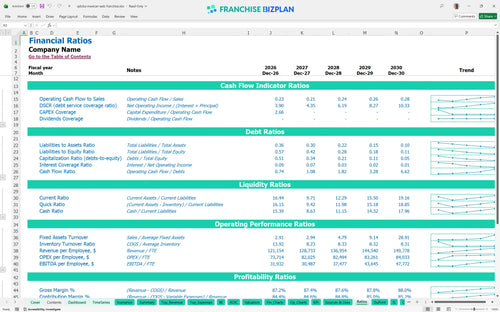
Performance metrics benchmark
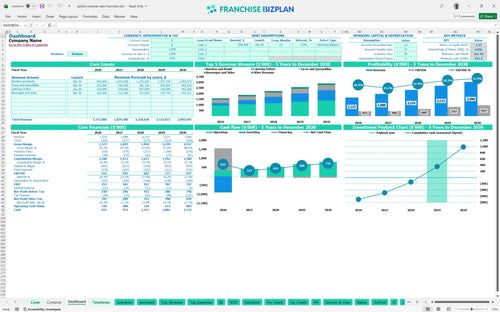
We built this franchise unit financial model using our own research to help you navigate the unit economics of this fast-casual Mexican concept. Key assumptions like the $1.57M year-one revenue and the 9.5% total franchise fee burden are pre-populated and fully editable to reflect your specific Mueller district location. Here is the quick math on how your investment performs over five years.
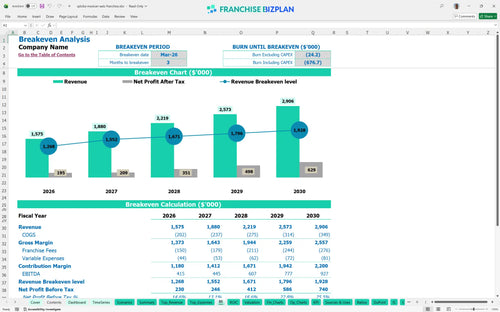
The unit is projected to reach profitability in March 2026, just three months after the initial launch. This rapid turnaround is driven by high-volume individual meal sales and the introduction of catering orders by June 2026. Profitability is a function of throughput and waste control.
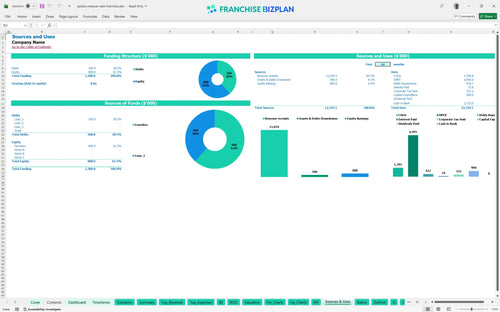
You need approximately $900,000 in upfront capital expenditure planning to open the doors, which covers the $380,000 build-out and $195,000 in kitchen equipment. The model also accounts for a $421,000 minimum cash reserve to handle the ramp-up phase through mid-2026. Capital allocation is about more than just buying stoves.
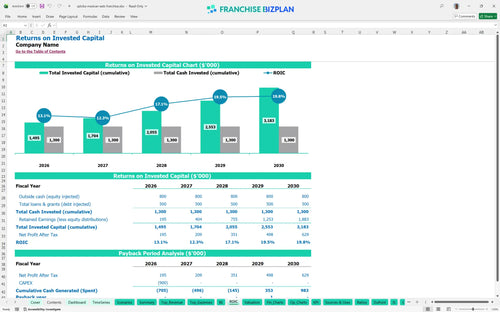
The model projects a 4-year payback period with an internal rate of return (IRR) of 3.95% and a return on equity (ROE) of 2.35. While the initial years focus on recovery, the year-five EBITDA reaches $927,000, showing strong long-term franchise return on investment. IRR tells the story of your capital's efficiency over time.
Monthly break-even occurs in March 2026, requiring the unit to generate enough volume to offset $16,000 in monthly rent and 11% food costs. The primary driver for reaching this point is the average ticket from burritos and bowls, which must remain steady against labor cost forecasting model targets. Volume is the only cure for high fixed rent.
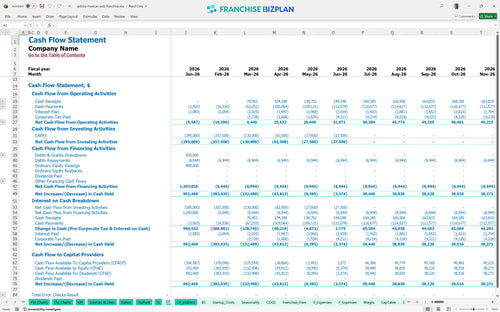
Your lowest cash point hits $421,000 in June 2026, meaning you need sufficient liquidity to cover the first six months of operations. We recommend maintaining this buffer to handle the gap between the $110,000 mobile lane investment and the ramp-up of recurring catering revenue. Cash is oxygen; don't run out during the climb.
A high-revenue scenario significantly improves the year-one $415,000 EBITDA, while a low-volume case would defintely stretch the 4-year payback period. The model allows you to test how fluctuations in food ingredients or delivery platform commissions impact your overall financial projections for new franchise location. Scenarios prepare you for the reality of the market.
This franchise unit financial model is fully customizable in Excel, featuring pre-filled formulas and editable assumptions that allow you to adapt the projections to your specific territory. You can adjust local labor rates, rent escalations, and regional pricing to see how they impact your store-level margin. Every 1-point margin leak matters fast in a single-unit model.

Plan for long-term growth with detailed 5-year revenue and cash flow projections tailored for a high-volume fast-casual environment. The model tracks the ramp-up from an initial $1.57M in annual sales to over $2.9M as you mature the catering and mobile order channels. Timing gaps between opening costs and mature-unit performance are the real killers.

This tool captures every franchise-specific obligation, including the initial $40,000 fee and the ongoing 5% royalty and 4.5% marketing fund contributions. By automating these calculations, you can see exactly how much cash stays in the unit after the franchisor takes their cut. Royalties come off the top, regardless of your bottom line.

Estimate your total entry cost, including $380,000 for leasehold improvements and $195,000 for kitchen equipment, to determine your total restaurant startup costs analysis. The model identifies the specific sales volume needed to cover your $16,000 monthly rent and variable expenses. Breakeven is a race against your fixed cost burn.

The model incorporates fast-casual industry benchmarks to help you sanity-check your food costs, which are projected to start at 11% of sales. Use these built-in metrics to compare your labor productivity and occupancy costs against top-tier performers in the Mexican restaurant sector. Benchmarks keep your assumptions from becoming fantasies.


Simply purchase and download the financial model template, then access it instantly using Microsoft Excel or Google Sheets. No installation or technical expertise required-just open and start working.

Enter your business-specific numbers, including revenue projections, costs, and investment details. The pre-built formulas will automatically calculate financial insights, saving you time and effort.

Leverage the investor-ready format to confidently showcase your financial projections to banks, franchise representatives, or investors. Impress stakeholders with clear, data-driven insights and professional reports.

Leverage the investor-ready format to confidently present your projections to banks, franchise representatives, or investors.