
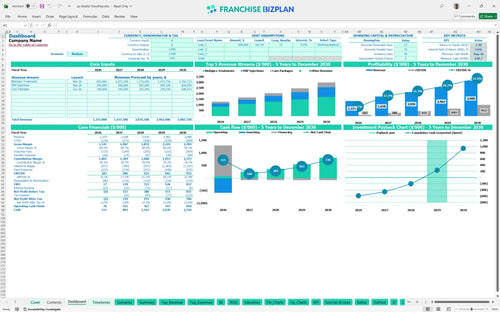
All-in-one Dashboard
Core inputs and core outputs


This Excel-based tool provides a structured way to forecast clinic revenue, manage medical payroll, and calculate investor returns for a specialized health center.
Core inputs and core outputs
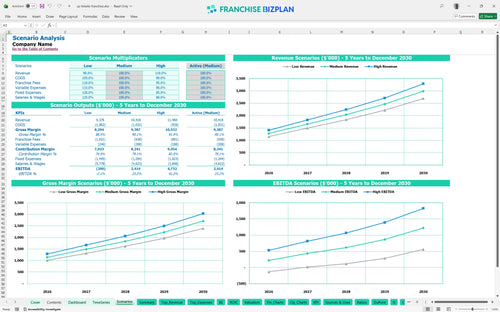
Three scenario analysis
Presentation ready
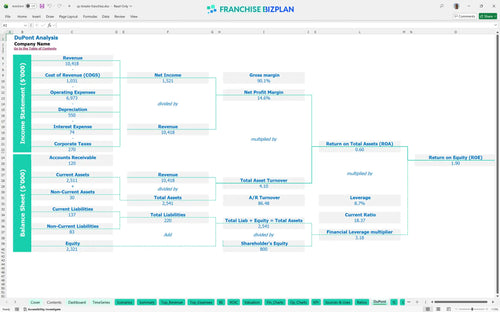
DuPont analysis
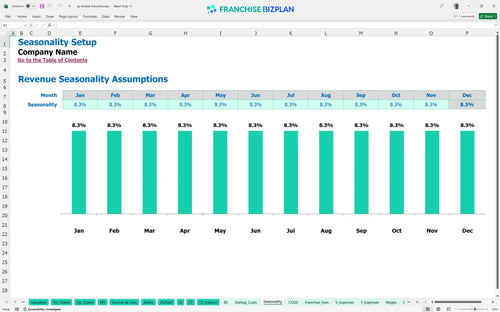
Researched revenue assumptions
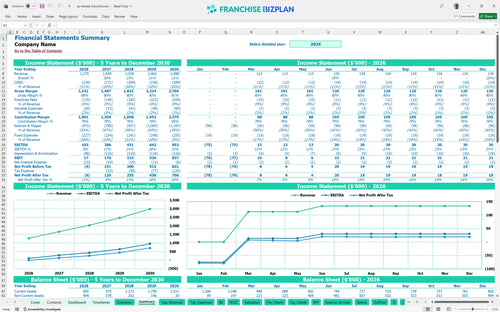
Lender-friendly financial outputs
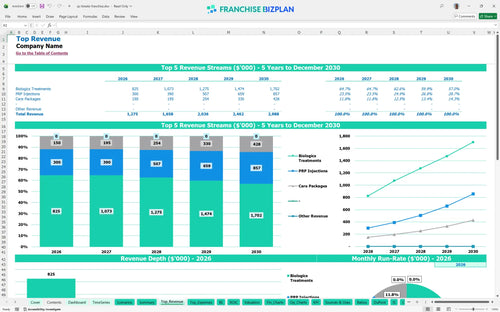
Revenue stream detailed view
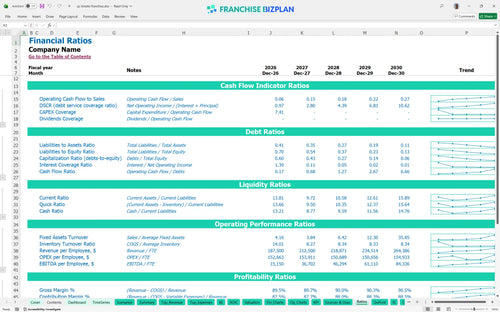
Performance metrics benchmark
We built this medical franchise financial model using detailed research on regenerative medicine clinic operations. Key assumptions, including revenue streams from biologics and care packages, $12,000 monthly rent, and specialized medical staffing, are pre-populated and fully editable to match your specific location. This model helps you track the path from a $1.27M year-one revenue base to long-term profitability.
This clinic reaches profitability in its first year, generating $103,000 in EBITDA. By year five, annual EBITDA grows to $953,000 as patient volume for biologics treatments and care packages matures and operational efficiencies improve.
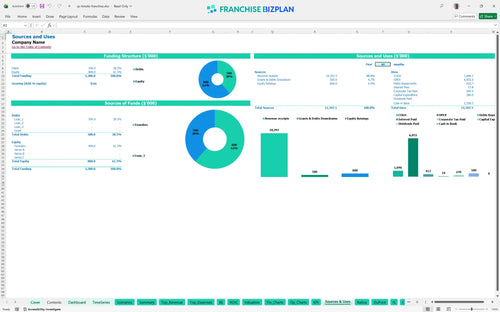
You need a significant capital stack to launch, with leasehold improvements and equipment alone totaling $410,000. The model shows a minimum cash requirement of $629,000 to cover the ramp-up phase through August 2026, including the $55,000 franchise fee.
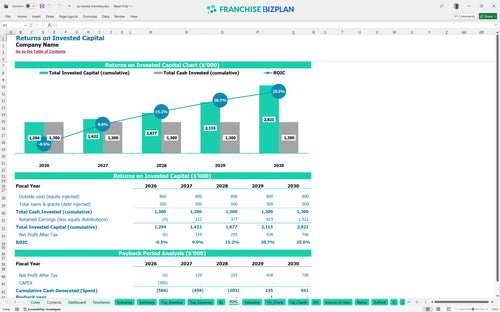
The model projects an Internal Rate of Return (IRR) of 3.77% and a Return on Equity (ROE) of 1.9. Full payback of the initial investment is defintely expected within 4 years of operation as the clinic reaches its $2.9M revenue potential.
The clinic hits its break-even date in April 2026, just 4 months after launch. High fixed costs like the $12,000 monthly rent and $200,000 medical director salary mean you need consistent patient volume to cover your monthly overhead.
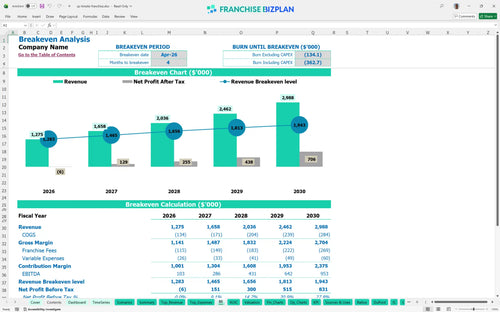
The lowest cash point occurs in August 2026 at $629,000 during the initial ramp-up. This reflects heavy front-end spending on build-out and the hiring of a Nurse Practitioner and Physician Assistant before patient revenue fully scales.
The model allows you to toggle between Low, Medium, and High cases to see how demand shifts impact cash. Changes in biologics treatment volume significantly impact the year-one EBITDA of $103,000 and the total cash needed during the first 12 months.
This medical franchise financial model is built in Excel with open formulas and editable assumptions. You can easily adjust patient volume, treatment pricing, and staffing levels to fit your specific clinic territory and local market conditions.

Plan for long-term scale with a full 60-month outlook tailored for a specialized clinic. The model tracks revenue scaling from $1.27M in year one to nearly $3M by year five, helping you visualize the transition from a single unit to a mature operation.

Account for every dollar owed to the franchisor to understand the real economics of the business. The model includes the $55,000 initial fee and calculates the ongoing 8% royalty and 1% marketing fund contributions based on gross sales projections.

Estimate your total entry cost, including $280,000 for leasehold improvements and $130,000 for medical equipment. This tool identifies the exact month you stop burning cash and start generating a surplus based on your fixed and variable costs.

Compare your projections against clinical standards to sanity-check your business plan. The model uses researched data for medical director salaries and biologics acquisition costs, which start at 9% of revenue, to ensure your plan stays realistic.


Simply purchase and download the financial model template, then access it instantly using Microsoft Excel or Google Sheets. No installation or technical expertise required-just open and start working.

Enter your business-specific numbers, including revenue projections, costs, and investment details. The pre-built formulas will automatically calculate financial insights, saving you time and effort.

Leverage the investor-ready format to confidently showcase your financial projections to banks, franchise representatives, or investors. Impress stakeholders with clear, data-driven insights and professional reports.

Leverage the investor-ready format to confidently present your projections to banks, franchise representatives, or investors.