


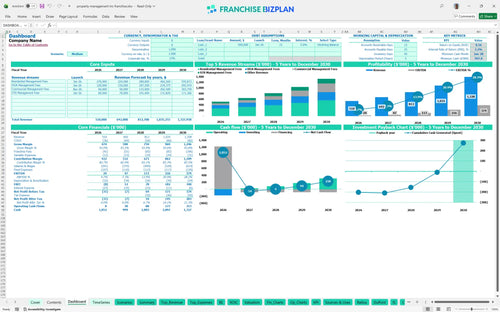
All-in-one Dashboard
Core inputs and core outputs



This comprehensive financial model provides everything a prospective owner needs to forecast revenue, manage expenses, and analyze the long-term ROI of a property management territory.
Core inputs and core outputs
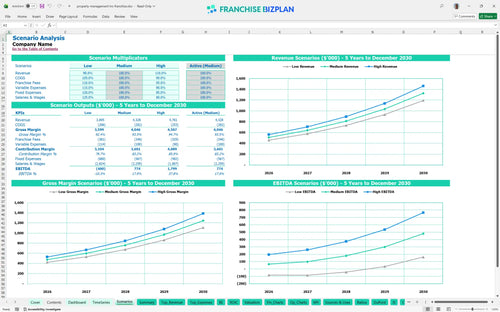
Three scenario analysis
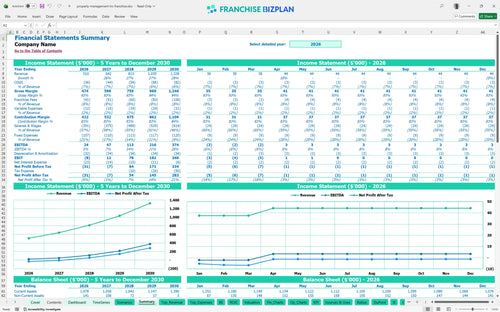
Presentation ready
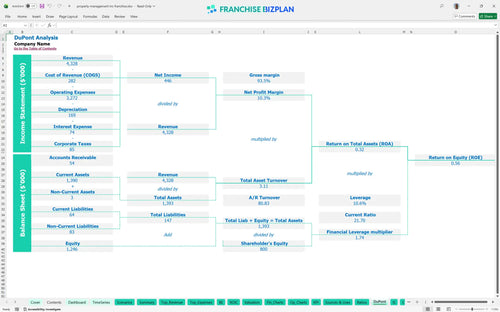
DuPont analysis
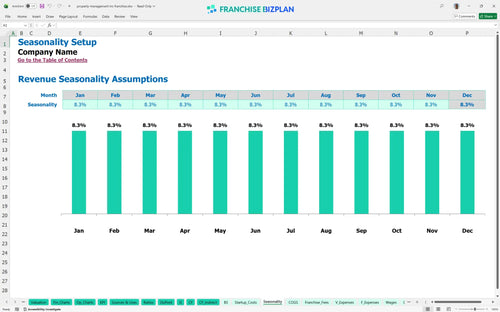
Researched revenue assumptions

Lender-friendly financial outputs
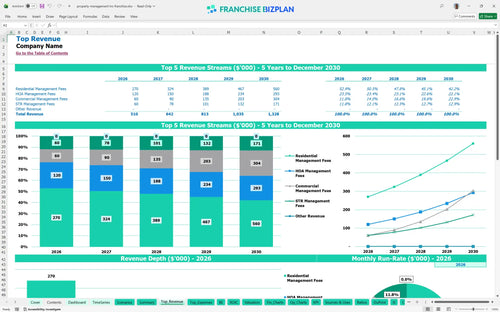
Revenue stream detailed view
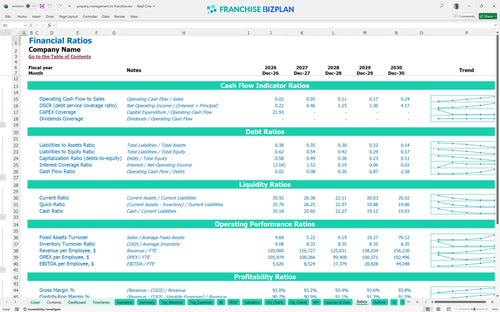
Performance metrics benchmark
We developed this financial model through extensive research into the multi-pillar property management sector to provide a realistic roadmap for new owners. The pre-populated data covers four revenue streams, including residential and HOA fees, and accounts for a $64,900 franchise fee and 8% total ongoing brand fees. With Year 1 revenue projected at $510,000 and Year 5 EBITDA reaching $374,000, this tool provides the data-driven confidence needed to evaluate this investment.
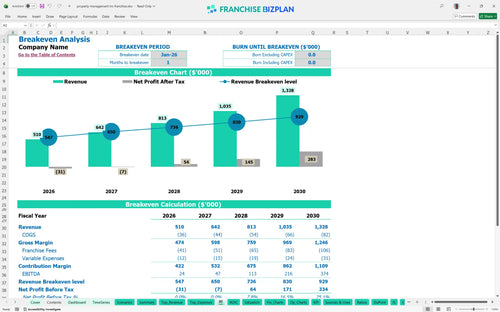
This franchise unit is designed for a fast start, reaching its break-even point in January 2026, just one month after launch. While Year 1 EBITDA is a modest $24,000 due to initial staffing and setup costs, profitability scales significantly to $113,000 by Year 3 as the portfolio of managed doors increases. Use this franchise profitability calculator to see how your net profit grows as you move past the initial ramp-up phase.
To get this business off the ground in the US, you will need approximately $172,400 in initial capital for equipment and setup, plus the $64,900 franchise fee. These startup financial requirements for real estate property management franchise units cover essential assets like an inspection vehicle and office signage. Here is the quick math: your total initial cash outlay must cover both these hard costs and the working capital needed to support a $21,000 monthly payroll during the first few months.
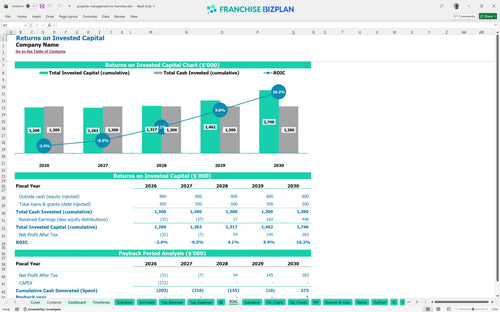
The property management franchise investment analysis shows a 5-year payback period and an Internal Rate of Return (IRR) of 3.16%. While the IRR appears conservative, the model shows a Return on Equity (ROE) of 0.56, reflecting the steady, recurring nature of management fees. This property management franchise ROI analysis spreadsheet helps you see how the compounding value of long-term contracts builds significant enterprise value by the end of the fifth year.
Your monthly break-even is primarily driven by the volume of doors under management and the associated leasing fees. With fixed costs and wages totaling roughly $29,900 per month, you need to generate enough management fees to cover this overhead plus the 8% royalty and marketing burden. Estimating revenue from property management franchise leasing fees is critical here, as those one-time payments provide the necessary cushion to reach break-even within the first month of operation.
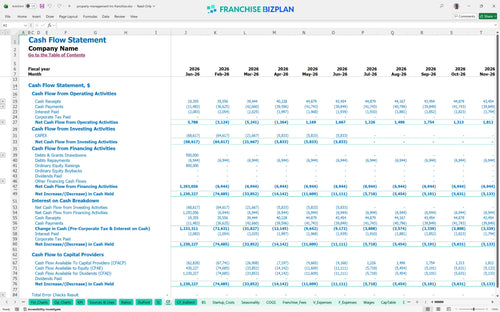
The operational expense model indicates that the lowest cash point occurs in January 2028, with a minimum cash balance of $998,000. This suggests a significant capital reserve is maintained to handle the scaling of the team, which grows to include 2.5 Administrative Assistants and 2.0 Property Managers by Year 5. To protect your cash flow during this growth, you should closely monitor the timing of your $6,000 monthly rent and large annual insurance payments.
Evaluating profitability of multi-pillar property management franchise units requires looking at Low, Medium, and High growth cases. In a High scenario, where you maximize the franchise financial model for short-term rental management business by hitting $171,366 in STR fees by Year 5, your EBITDA will defintely exceed the $374,000 baseline. Conversely, a Low scenario with slower HOA contract adoption will extend your payback period and require more working capital to cover the $252,000 annual Year 1 wage bill.
This property management franchise financial model is built entirely in Excel, giving you total control over the underlying logic and assumptions. You can easily modify pre-filled formulas to match your specific territory, whether you are adjusting the Excel template for property management franchise financial forecasting to account for local rent or shifting labor rates. It is a flexible tool designed to handle the unique variables of a multi-pillar service business without the headache of building a spreadsheet from scratch.

Success in this industry requires a long-term view, and these franchise unit financial projections map out your path from year one through year five. The model tracks a revenue climb from $510,000 in the first year to over $1.32 million by year five, allowing you to visualize how scaling residential and commercial contracts impacts your bottom line. This financial model for residential and commercial property management franchise units ensures you see the full picture of your potential equity growth over time.

Franchise-specific costs can erode margins if they are not tracked with precision, so this model integrates royalty fee forecasting directly into your monthly P&L. With a 7% royalty and a 1% marketing fund contribution, you will see exactly how much of your $510,000 first-year revenue goes toward brand support. It accounts for the $64,900 initial franchise fee upfront, ensuring your cash flow projections reflect the true cost of staying compliant with brand standards.

Launching a new territory requires significant capital, and this franchise startup cost spreadsheet breaks down every dollar needed before you open your doors. By using the property management franchise operational budget template, you can see how the $172,400 in initial capital expenditures-including office improvements and vehicles-affects your timeline to profitability. The model identifies the exact month your management fees cover your $8,900 in monthly fixed operating costs.

We have integrated real-world unit economics analysis to help you sanity-check your assumptions against industry norms. For example, the model sets prime office rent at $6,000 per month and scales staffing from an initial Operations Manager at $80,000 to a full team as your portfolio grows. These benchmarks prevent you from underestimating the cost of high-touch service while maintaining the margins necessary for a healthy EBITDA, which starts at $24,000 in your first year.


Simply purchase and download the financial model template, then access it instantly using Microsoft Excel or Google Sheets. No installation or technical expertise required-just open and start working.

Enter your business-specific numbers, including revenue projections, costs, and investment details. The pre-built formulas will automatically calculate financial insights, saving you time and effort.

Leverage the investor-ready format to confidently showcase your financial projections to banks, franchise representatives, or investors. Impress stakeholders with clear, data-driven insights and professional reports.

Leverage the investor-ready format to confidently present your projections to banks, franchise representatives, or investors.